Zinger Key Points
- Analysts estimate Meta will print earnings per share of $2.22 on revenues of $31.53 billion.
- Meta is trading in a bull flag formation just under the 200-day SMA.
- Don't face extreme market conditions unprepared. Get the professional edge with Benzinga Pro's exclusive alerts, news advantage, and volatility tools at 60% off today.
Meta Platforms, Inc META is set to print its fiscal fourth-quarter financial results after the market closes Wednesday. The stock was trading almost 2% higher heading into the event.
When the tech giant printed its third-quarter results on Oct. 26, the stock plunged about 23% the following day and an additional 10% over the five days that followed before reversing into an uptrend off the $88.09 level.
For the third quarter, Meta reported EPS of $1.64 on revenue of $27.71 billion. The company missed the EPS estimate of $1.91 but beat the estimate of $27.53 billion in revenues.
For the fourth quarter, analysts estimate Meta will print earnings per share of $2.22 on revenues of $31.53 billion.
Here's what to watch when Meta's earnings print after the bell.
Ahead of the event, LightShed Partners analyst Richard Greenfield announced a Buy rating on Meta and applied a price target of $200 on Tuesday. On Jan. 26, Piper Sandler analyst Thomas Champion maintained a Neutral rating on the stock and raised the price target from $116 to $136.
From a technical analysis perspective, Meta’s stock looks set to trade higher over the coming days due to the confirmation of an uptrend and a bull flag pattern, but it should be noted that holding stocks or options over an earnings print is akin to gambling because stocks can react bullishly to an earnings miss and bearishly to an earnings beat.
Options traders, particularly those who are holding close dated calls or puts, take on extra risk because the institutions writing the options increase premiums to account for implied volatility.
Want direct analysis? Find me in the BZ Pro lounge! Click here for a free trial.
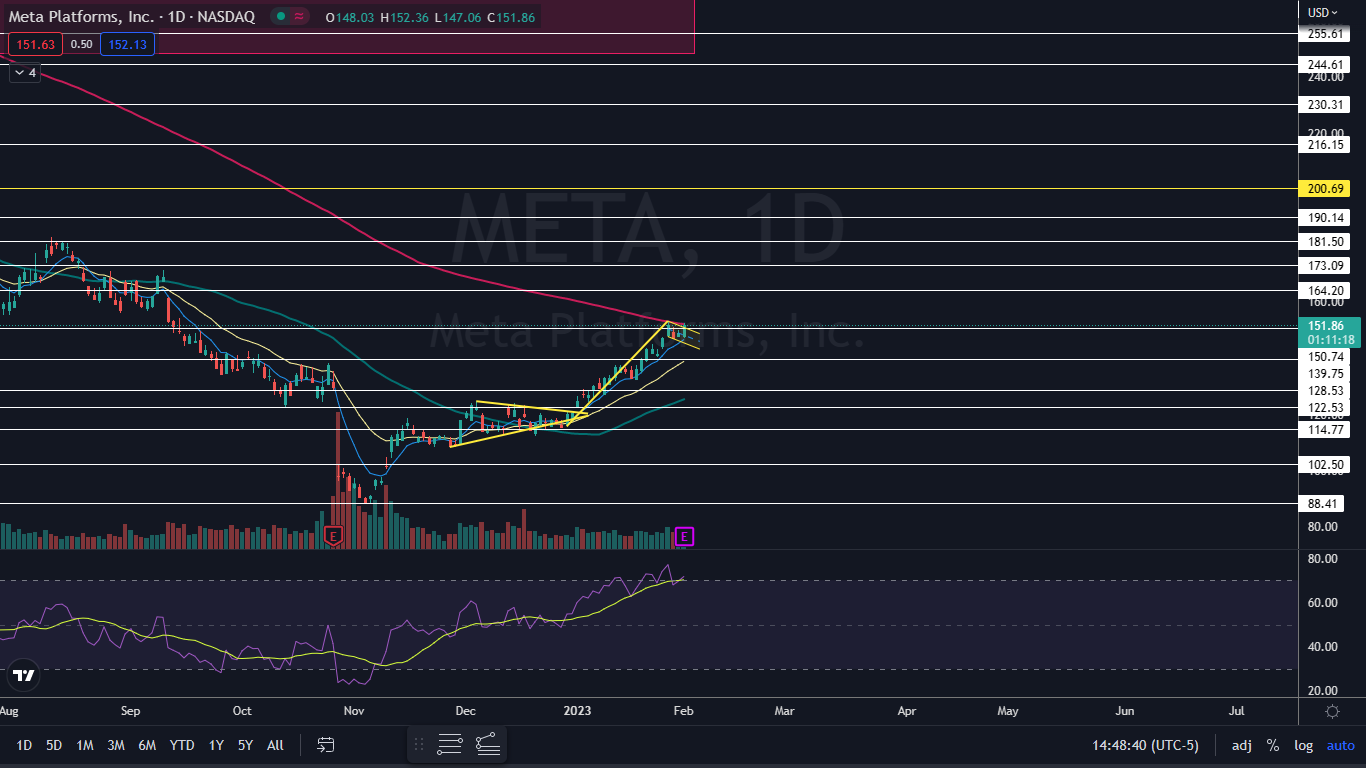
The Meta Chart: Meta settled into a bull flag formation between Dec. 29 and Wednesday, with the pole formed between Dec. 29 and Jan. 27 and the flag forming over the trading days that have followed.
On Wednesday, Meta was attempting to break up through the upper descending trendline of the flag.
- The top of the bull flag sits just under the 200-day simple moving average (SMA), which has been acting as resistance. It’s healthy when a stock consolidates just under or above the 200-day SMA, and if Meta receives a positive reaction to its earnings print, the stock is likely to break up from the bull flag and reclaim the 200-day as support.
- Meta is also trading in a strong uptrend pattern, making a consistent series of higher highs and higher lows. If Meta falls following the earnings print, bullish traders will want to see the stock reverse course above $140 so the trend remains intact.
- If Meta surges higher following its print, the measured move of the bull flag is about 32%, which suggests the stock could eventually rally toward $194, although retracements are likely to occur along the way.
- Meta has resistance above at $164.20 and $173.09 and support below at $150.74 and $139.75.
 Read Next: Meta Options Traders Betting On Stock Jumping At Least This Much By March Expiration
Photo via Shutterstock.
Edge Rankings
Price Trend
© 2025 Benzinga.com. Benzinga does not provide investment advice. All rights reserved.
Trade confidently with insights and alerts from analyst ratings, free reports and breaking news that affects the stocks you care about.