Zinger Key Points
- Analysts expect Ford to report an EPS of 62 cents on revenues of $40.37 billion.
- Ford is trading in an uptrend and regained support at the 200-day SMA on Tuesday.
- Feel unsure about the market’s next move? Copy trade alerts from Matt Maley—a Wall Street veteran who consistently finds profits in volatile markets. Claim your 7-day free trial now.
Ford Motor Company F is set to print its fourth-quarter financial results after the market close today (Feb. 2). The stock was motoring north heading into the event, trading up more than 5%.
When the legacy-turning-electric vehicle manufacturer printed its third-quarter results on Oct. 26, the stock was trading in a steep uptrend, which continued until Nov. 11, when Ford rejected the 200-day simple moving average and reversed course.
For the third quarter, Ford reported mixed results. The company printed EPS of 30 cents, which missed the consensus estimate of 32 cents. Ford beat on the top line, reporting revenues of $37.19 billion compared to the $36-billion estimate.
For the fourth quarter, analysts expect Ford to report an EPS of 62 cents on revenues of $40.37 billion.
On Jan. 25, JP Morgan analyst Ryan Brinkman maintained an Overweight rating on Ford on Tuesday and lowered the price target from $16 to $15.
From a technical analysis standpoint, Ford’s stock looks headed higher following the earnings print but may be due for a short-term pullback. It should be noted that holding stocks or options over an earnings print is akin to gambling because stocks can react bullishly to an earnings miss and bearishly to an earnings beat.
Options traders, particularly those who are holding close-dated calls or puts, take on the extra risk because the intuitions writing the options increase premiums to account for implied volatility.
Want direct analysis? Find me in the BZ Pro lounge! Click here for a free trial.
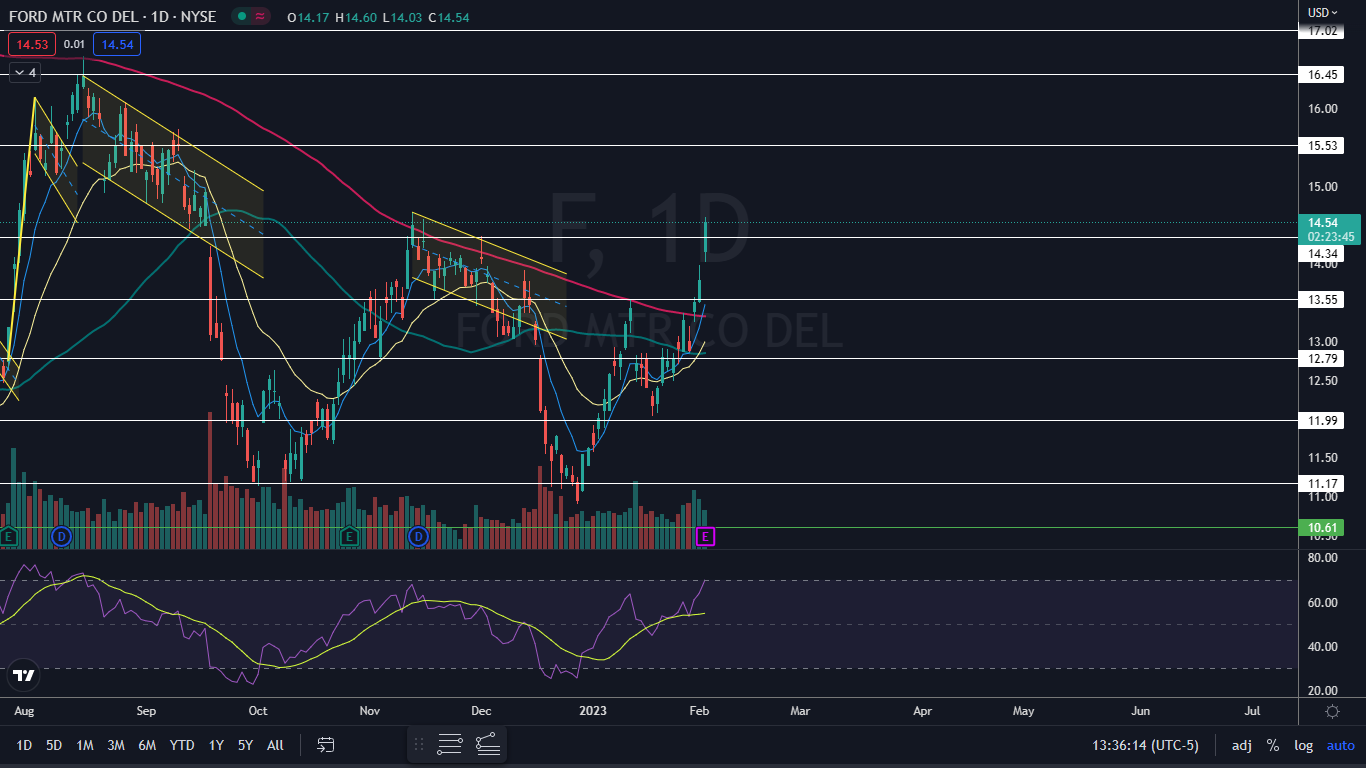
The Ford Chart: Ford reversed into its most recent uptrend on Dec. 28, when the stock bounced up off the $10.90 mark. Ford’s most recent higher low was formed on Jan. 19 at $12.04 and the most recent confirmed higher high was printed at the $13.53 mark on Jan. 12, when the stock rejected the 200-day simple moving average (SMA).
- On Tuesday, Ford gapped up above the 200-day SMA, indicating a new bull cycle could be on the horizon. Since then, Ford has printed two big bullish candlesticks, rising up over 8% off the 200-day.
- The recent sharp rise caused Ford’s relative strength index (RSI) to reach the 70% mark. When a stock’s RSI reaches or exceeds that level, it becomes overbought, which can be a sell signal for technical traders.
- If Ford receives a bullish reaction to its earnings print and flies higher again on Friday, a pullback is likely imminent. If the stock receives a neutral reaction, an inside bar may print, which would lean bullish for a continuation higher into next week.
- If Ford suffers a bearish reaction and falls lower, the stock may find support at the 200-day SMA. It would be considered healthy for the stock to retest that level and hold above it. If Ford were to head below the 200-day, a downtrend could be in the cards.
- Ford has resistance above at $15.53 and $16.45 and support below at $14.34 and $13.55.
 Read Next: Rivian Automotive Plans To Slash 6% Of Workforce: Report
Edge Rankings
Price Trend
© 2025 Benzinga.com. Benzinga does not provide investment advice. All rights reserved.
Trade confidently with insights and alerts from analyst ratings, free reports and breaking news that affects the stocks you care about.