
Zinger Key Points
- AMC is trading in an inside bar pattern, which leans bullish because the stock is in an uptrend.
- If AMC breaks up from the pattern, the stock may find resistance at the 200-day SMA.
- Get 5 stock picks identified before their biggest breakouts, identified by the same system that spotted Insmed, Sprouts, and Uber before their 20%+ gains.
AMC Entertainment Holdings, Inc AMC was spiking up over 5% at one point on Monday but on lower-than-average volume.
The movie theater chain has seen increased interest from investors, along with several other retail-favorite stocks that underwent short squeezes over the last two years.
StockTwits CEO Rishi Khanna sees continued interest in AMC on that platform and noted the stock was the most discussed in 2021 and 2022 during a recent interview with Benzinga.
See Also: How Much $100 In AMC, Gamestop Would Be Worth If Stocks Hit Highs From Meme-Trade Halts
AMC, which just unveiled details about its “Sightline at AMC” program (dividing theater seats into tiers of varying prices), looks set to trade higher. On Monday, the stock was forming an inside bar pattern on the daily chart. An inside bar pattern indicates a period of consolidation and is usually followed by a continuation move in the direction of the current trend.
An inside bar pattern has more validity on larger time frames (four-hour chart or larger). The pattern has a minimum of two candlesticks and consists of a mother bar (the first candlestick in the pattern) followed by one or more subsequent candles. The subsequent candle(s) must be completely inside the range of the mother bar and each is called an "inside bar."
Either a double or triple inside bar can be more powerful than a single inside bar. After the break of an inside bar pattern, traders want to watch for high volume for confirmation the pattern was recognized.
Bullish traders will want to search for inside bar patterns on stocks that are in an uptrend. Some traders may take a position during the inside bar prior to the break while other aggressive traders will take a position after the break of the pattern.
For bearish traders, finding an inside bar pattern on a stock that's in a downtrend will be key. Like bullish traders, bears have two options of where to take a position to play the break of the pattern. For bearish traders, the pattern is invalidated if the stock rises above the highest range of the mother candle.
Want direct analysis? Find me in the BZ Pro lounge! Click here for a free trial.
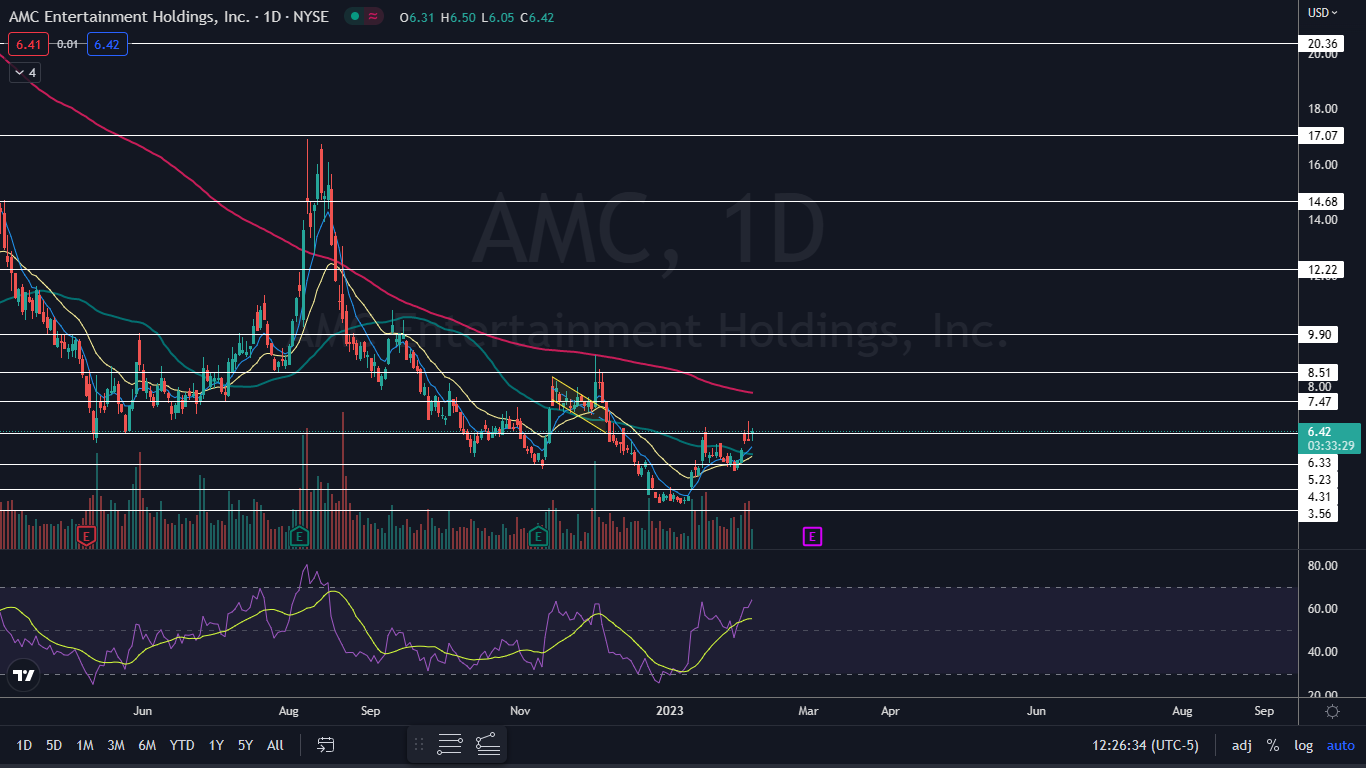
The AMC Chart: AMC confirmed a new uptrend on Friday by printing a higher high at the $6.77 mark, which was above the most recent high of $6.55 that was printed on Jan. 18. On Monday, the stock was forming an inside bar pattern, with all the price action taking place within Friday’s range.
- The pattern leans bullish in this case because AMC was trading higher before forming the inside bar. Traders and investors can watch for AMC to break up or down from Friday’s mother bar later on Monday or on Tuesday, on higher-than-average volume, to gauge future direction.
- If AMC breaks up from the inside bar formation and surges higher, the stock may find resistance at the 200-day simple moving average (SMA). The 200-day SMA is a bellwether indicator that acts as strong resistance and support, making it difficult for a stock to break through the area on the first attempt.
- If AMC closes Monday’s trading session with a significant lower wick, the stock will print a hammer candlestick, which could indicate higher prices and a break up from Friday’s high-of-day is on the horizon. If the stock closes the trading day near its low-of-day price, continued consolidation may be in the cards.
- AMC has resistance above at $7.47 and $8.51 and support below at $6.33 and $5.23.
 Next: AMC Works Around Shareholder Opposition For Capital Raise Via Dilutive Stock Sale
© 2025 Benzinga.com. Benzinga does not provide investment advice. All rights reserved.
Trade confidently with insights and alerts from analyst ratings, free reports and breaking news that affects the stocks you care about.

