
Zinger Key Points
- Apple is trading in a triangle pattern, forming a series of higher lows and lower highs.
- The stock is set to break from the pattern on or before March 6.
- Our government trade tracker caught Pelosi’s 169% AI winner. Discover how to track all 535 Congress member stock trades today.
Apple Inc AAPL gapped down about 0.9% lower on Friday and was continuing to fall intraday.
Hot producer price index data released on Thursday didn’t appear to spook investors and Apple led the stock market higher, with the big-tech company rallying more than 2% at one point before sliding to close mostly flat.
Hawkish language from St. Louis President James Bullard, where he advocated for a 0.5% rate hike at the Fed’s next meeting, kicked off the Thursday afternoon selling spree.
On Friday, Fed Gov. Michelle Bowman said the central bank needs to continue raising the federal fund rate until inflation becomes progressively lower. She noted that although inflation looked to be ticking lower late last year, this year the data isn’t showing sustained progress, according to a Reuters report.
The bearish sentiment in the markets late Thursday into Friday, caused Apple to decline back toward the bottom ascending trendline in a triangle pattern that the stock started trading on Feb. 3.
Want direct analysis? Find me in the BZ Pro lounge! Click here for a free trial.
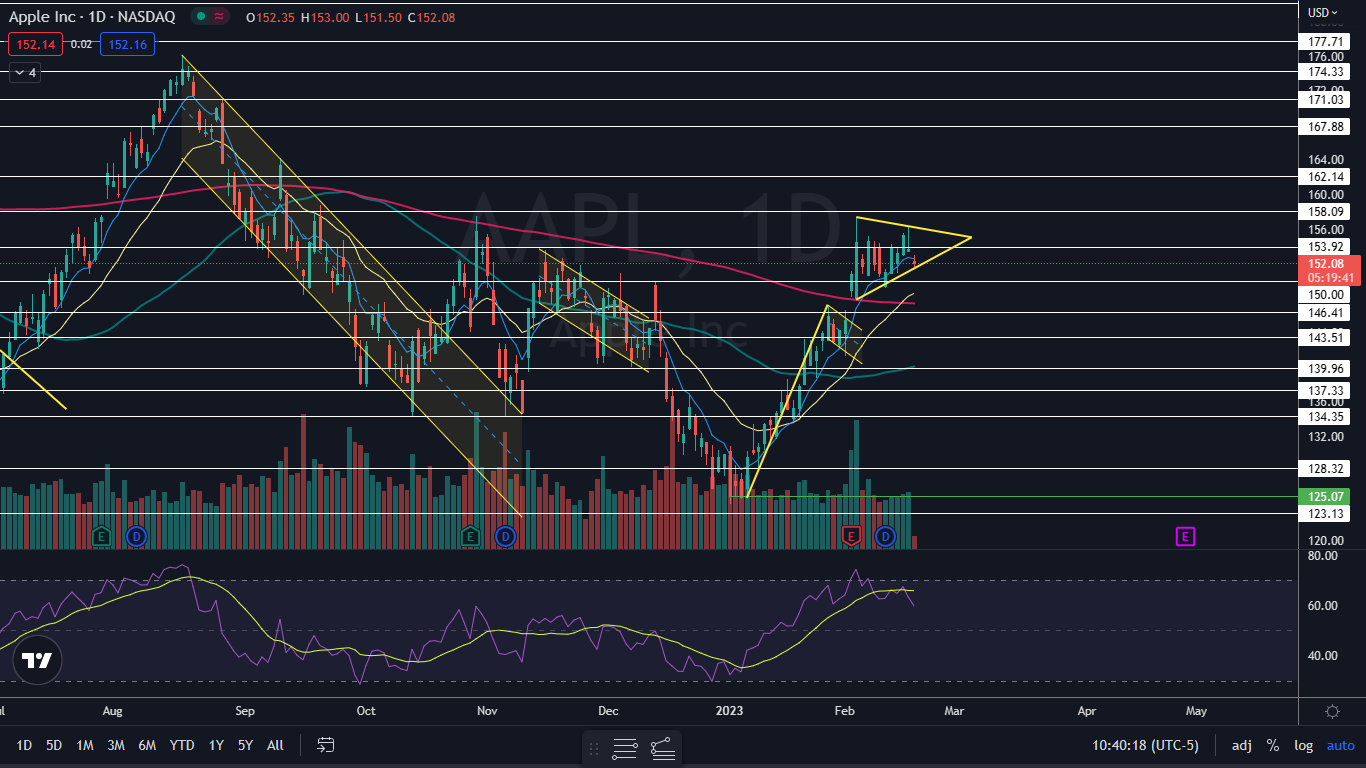
The Apple Chart: Within the triangle pattern, Apple had been making a series of lower highs and higher lows. The stock is set to meet the apex of the triangle on March 6 and traders and investors can watch for the stock to break up or down from the pattern on higher-than-average volume before that date to gauge future direction.
- On Friday, Apple was working to print a doji candlestick, which could indicate the next higher low has occurred and Apple will trade higher on Monday. If that happens, bullish traders would like to see the stock break above the upper descending trendline of the triangle, while bearish traders would like to see Apple reject the trend line.
- If Apple breaks down from the pattern, the stock may find support at the 200-day simple moving average (SMA). If Apple is able to remain trading above the area, the 50-day SMA will eventually cross above the 200-day, which would cause a golden cross to form.
- If Apple were to break under the 200-day SMA, the bears would regain firm control and a longer-term downtrend could be in the cards.
- Apple has resistance above at $153.92 and $158.09 and support below at $150 and $146.41.
Read Next: Uber Eats Courier Allegedly Steals Apple Products Worth $2,000
Photo: Shutterstock
© 2025 Benzinga.com. Benzinga does not provide investment advice. All rights reserved.
Trade confidently with insights and alerts from analyst ratings, free reports and breaking news that affects the stocks you care about.

