Zinger Key Points
- Bitcoin has been holding up more strongly than the general market recently, trading just under $25,000.
- If Bitcoin breaks bullishly from Tuesday's high-of-day, it may find resistance at the golden pocket.
- Feel unsure about the market’s next move? Copy trade alerts from Matt Maley—a Wall Street veteran who consistently finds profits in volatile markets. Claim your 7-day free trial now.
Bitcoin BTC/USD spiked up to reach $25,288 during Tuesday’s 24-hour trading session –a price not seen since June 13 of last year –before rejecting the level and declining slightly from Monday’s closing price.
The crypto sector has shown strength in comparison to the general market recently, with the S&P 500 falling over 4% since reaching a six-month high of 4,195.44 on Feb. 2. Bitcoin is trading almost 5% higher since that date, while Ethereum ETH/USD is up almost 2%. Dogecoin has fallen over that time frame but has been consolidating sideways since Feb. 9.
Bitcoin has also shown strength compared the gold. The latter, which has traded more in tandem with the general market, declining almost 6% since the start of the month.
Bitcoin’s strength has some traders and investors believing the crypto could be an alternative recession hedge to gold –an idea crypto enthusiasts have held for some time but can’t be proven due to Bitcoin’s lack of trading history during a long-term and severe bear market.
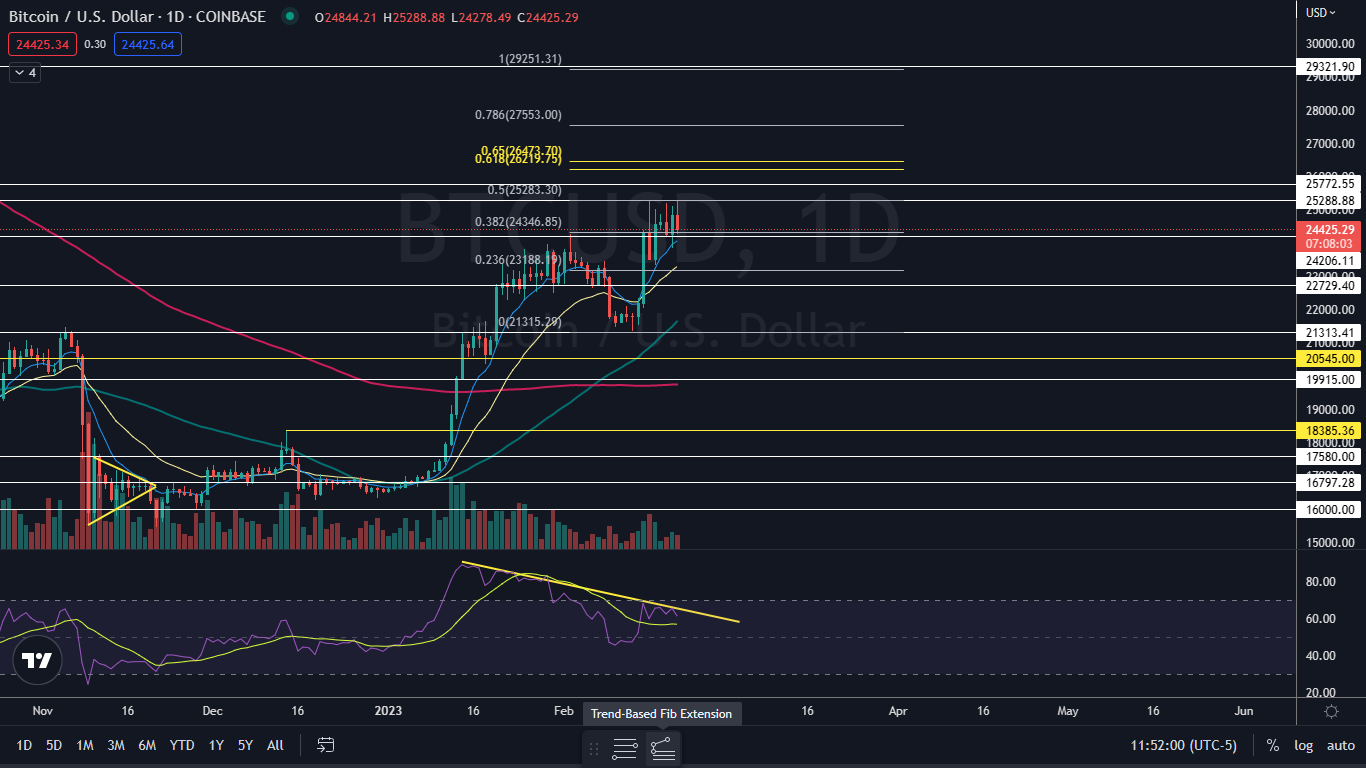
The resistance near the $25,000 mark that Bitcoin is experiencing is likely due to that area being an important psychological level, as well as the 0.5 Fibonacci extension area.
Want direct analysis? Find me in the BZ Pro lounge! Click here for a free trial.
The Bitcoin Chart: Bitcoin broke up temporarily from Monday’s trading range on Tuesday after opening with an inside bar pattern. The crypto has been trading mostly within its Feb. 16 trading range since that date, on generally decreasing volume, which indicates Bitcoin is in a period of consolidation.
- The consolidation has caused Bitcoin’s relative strength index (RSI) to cool down from being in overbought territory, which could give the crypto the power needed to reclaim the $25,000 level as support. If that happens, the bearish divergence, which has been developing since Jan. 14 will correct.
- The bearish divergence may concern bullish traders, however, and could give bears the upper hand if the crypto breaks down from its sideways trading pattern. Bearish divergence occurs when a stock or crypto makes higher highs while its RSI makes a series of lower lows.
- If Bitcoin breaks up above the $25,000 mark, it may find resistance at the next Fibonacci extension level at about $26,400, which aligns with the golden pocket.
- Bitcoin has resistance above at $25,288 and $25,772 and support below at $24,206 and $22,729.
 Read Next: World Wide Web Creator Calls Crypto 'Really Dangerous'
Edge Rankings
Price Trend
© 2025 Benzinga.com. Benzinga does not provide investment advice. All rights reserved.
Trade confidently with insights and alerts from analyst ratings, free reports and breaking news that affects the stocks you care about.