Zinger Key Points
- FAZ is trading in an uptrend but hasn't printed a higher low since March 6.
- When FAZ retraces, bullish traders want to see the ETF hold above the 200-day SMA.
- Every week, our Whisper Index uncovers five overlooked stocks with big breakout potential. Get the latest picks today before they gain traction.
The Direxion Financial Bear 3X Shares ETF FAZ was surging over 10% higher on Monday, with continued bullish momentum following the recent collapse of SVB Financial Group and Signature Bank, which has investors bearish on the banking industry.
FAZ is a triple leveraged fund that is designed to inversely outperform the Financial Select Sector Index.
Some of the more familiar names the ETF tracks include Berkshire Hathaway (NYSE: BRK-A) (NYSE: BRK-B), weighted at 14.85%; JP Morgan Chase & Co JPM, weighted at 10.50% and Bank of America BAC, which has a 6.17% weighting within the fund.
It should be noted that leveraged ETFs are meant to be used as a trading vehicle as opposed to a long-term investment by experienced traders. Leveraged ETFs should never be used by an investor with a buy-and-hold strategy or those who have low risk appetites.
For traders wanting to play the financial sector bullishly, Direxion offers the Direxion Financial Bull 3X Shares ETF FAS.
Want direct analysis? Find me in the BZ Pro lounge! Click here for a free trial.
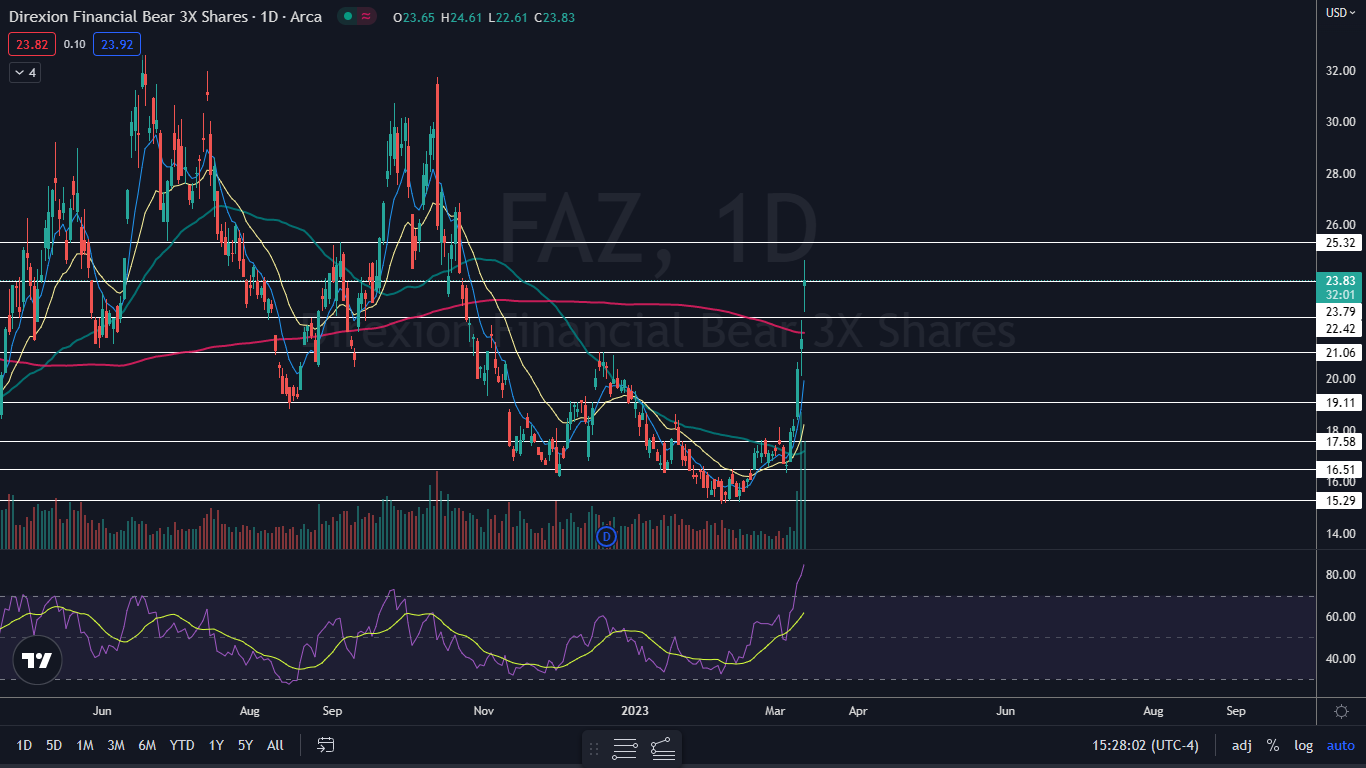
The FAZ Chart: FAZ gapped up about 9.8% higher on Monday, putting the ETF above the 200-day simple moving average, which is bullish. The ETF has been trading in an uptrend since Feb. 7, making a series of higher highs and higher lows, but hasn’t retraced to form a higher low since March 6.
- Eventually, FAZ will retrace to print at least a higher low, which may take place on Tuesday because on Monday, the ETF printed a doji candlestick. When found at a local top, a doji candlestick can signal a reversal to the downside is imminent.
- If that happens, bullish traders will want to see the ETF form a bullish reversal candlestick, such as a doji or hammer candlestick, above the 200-day, which could provide a solid entry point for a swing higher. If FAZ falls under the 200-day SMA, it could signal the current uptrend is over, which could provide a solid entry into its bullish counterpart, FAS.
- FAZ has resistance above at $23.79 and $25.32 and support below at $22.42 and $21.06.

Read Next: Biden Addresses FDIC Bank Takeovers: 'The Banking System Is Safe'
Edge Rankings
Price Trend
© 2025 Benzinga.com. Benzinga does not provide investment advice. All rights reserved.
Trade confidently with insights and alerts from analyst ratings, free reports and breaking news that affects the stocks you care about.