Zinger Key Points
- NUGT is a double-leveraged fund that is designed to outperform the NYSE Arca Gold Miners Index by 200%.
- The ETF negated its downtrend but hasn't yet confirmed an uptrend by printing a higher low.
- Feel unsure about the market’s next move? Copy trade alerts from Matt Maley—a Wall Street veteran who consistently finds profits in volatile markets. Claim your 7-day free trial now.
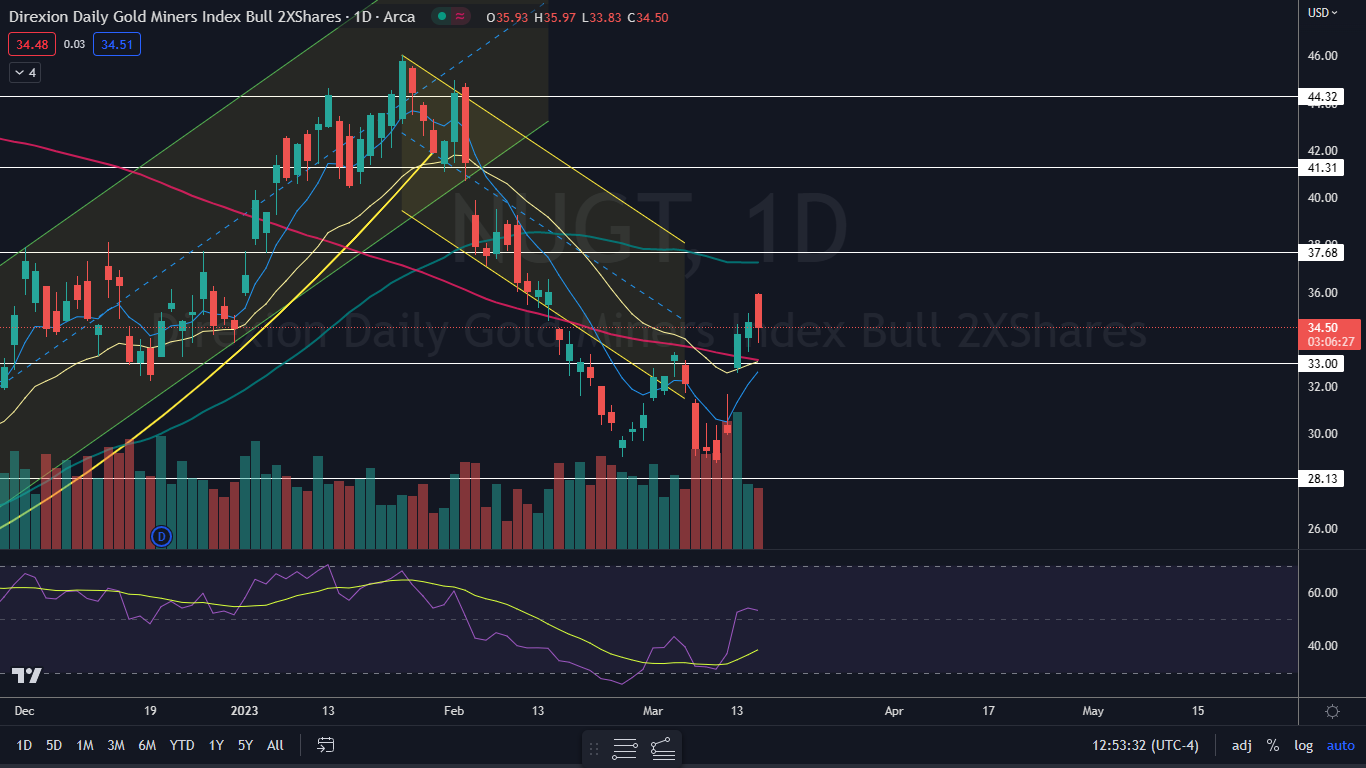
Direxion Daily Gold Miners Index Bull 2X Shares NUGT gapped up 3.4% higher on Wednesday, where the ETF ran into a group of sellers who knocked it down over 4% from the open.
Spot gold was rising higher Wednesday as markets tumbled following news Swiss bank Credit Suisse found material weaknesses in its financial reporting over the past two years due to ineffective internal controls.
Investors are now worried that the financial sector remains on shaky ground after three U.S. banks collapsed over the last week.
Want direct analysis? Find me in the BZ Pro lounge! Click here for a free trial.
Producer price index data, which came in better-than-expected, did little to boost the market. Investors may be choosing to sit on the sidelines until the Federal Reserve issues its decision on rate hikes next week.
In contrast, NUGT, which usually trades in tandem with spot gold, was consolidating slightly lower, likely for technical analysis reasons, because the ETF hasn’t traded sideways or slightly down since March 9.
NUGT is a double-leveraged fund that is designed to outperform the NYSE Arca Gold Miners Index by 200%. The ETF tracks several gold and silver mining companies, with Newmont Corp NEM, Barrick Gold Corp GOLD and Franco-Nevada Corp FNV making up 31.56% of its holdings.
It should be noted that leveraged ETFs are meant to be used as a trading vehicle by experienced traders, as opposed to a long-term investment. Leveraged ETFs should never be used by an investor with a buy-and-hold strategy or those who have low-risk appetites.
For traders wanting to play the gold mining index bearishly, Direxion offers Direxion Daily Gold Miners Index Bear 2X Shares DUST.
The NUGT Chart: NUGT negated its downtrend on Monday by rising up above the most recent lower high, which was formed on March 3 at $33.44. Although the downtrend is negated, a new uptrend won’t be confirmed until the ETF retraces to print a higher low above $28.74.
When NUGT spiked higher on Monday, the ETF regained the 200-day simple moving average (SMA), which suggests a new bull cycle could be on the horizon. If NUGT retraces to print a higher low over the next few days, bullish traders want to see the ETF form a bullish reversal candlestick, such as a doji or hammer candlestick, above the 200-day SMA, which could provide a solid entry position.
Bearish traders may want to wait for NUGT to rise up to reach the 50-day SMA, which is likely to act as at least temporary resistance. If the ETF rises to that level and prints a bearish reversal candlestick there, it could provide a solid entry into DUST.
NUGT has resistance above at $37.68 and $41.31 and support below at $33 and $28.13.
 Next: Banking Volatility Spills Over Into Oil Market - What Investors Need To Know
© 2025 Benzinga.com. Benzinga does not provide investment advice. All rights reserved.
Trade confidently with insights and alerts from analyst ratings, free reports and breaking news that affects the stocks you care about.