Zinger Key Points
- SPXL is a triple leveraged fund that tracks the price action of the SPY.
- The ETF is trading in an uptrend, making a series of higher highs and higher lows.
- Find out which stock just claimed the top spot in the new Benzinga Rankings. Updated daily— discover the market’s highest-rated stocks now.
The SPDR S&P 500 SPY gapped up over 1% higher on Wednesday to trade back within a rising channel from which the market ETF broke bearishly on Tuesday.
Whether or not the market will continue higher or trade sideways to consolidate Wednesday’s move higher remains to be seen, but an uptrend has been confirmed, which could provide a solid trade for bullish traders.
Want direct analysis? Find me in the BZ Pro lounge! Click here for a free trial.
More experienced traders who wish to play the SPY either bullishly or bearishly may choose to do so through one of two Direxion ETFs. Bullish traders can enter a short-term position in Direxion Daily S&P 500 Bull 3X Shares SPXL and bearish traders can trade the inverse ETF, Direxion Daily S&P 500 Bear 3X Shares SPXS.
The ETFs: SPXL and SPXS are triple leveraged funds that track the movement of the SPY, seeking a return of 300% or –300% on the return of the benchmark index over a single day.
It should be noted that leveraged ETFs are meant to be used as a trading vehicle as opposed to long-term investments.
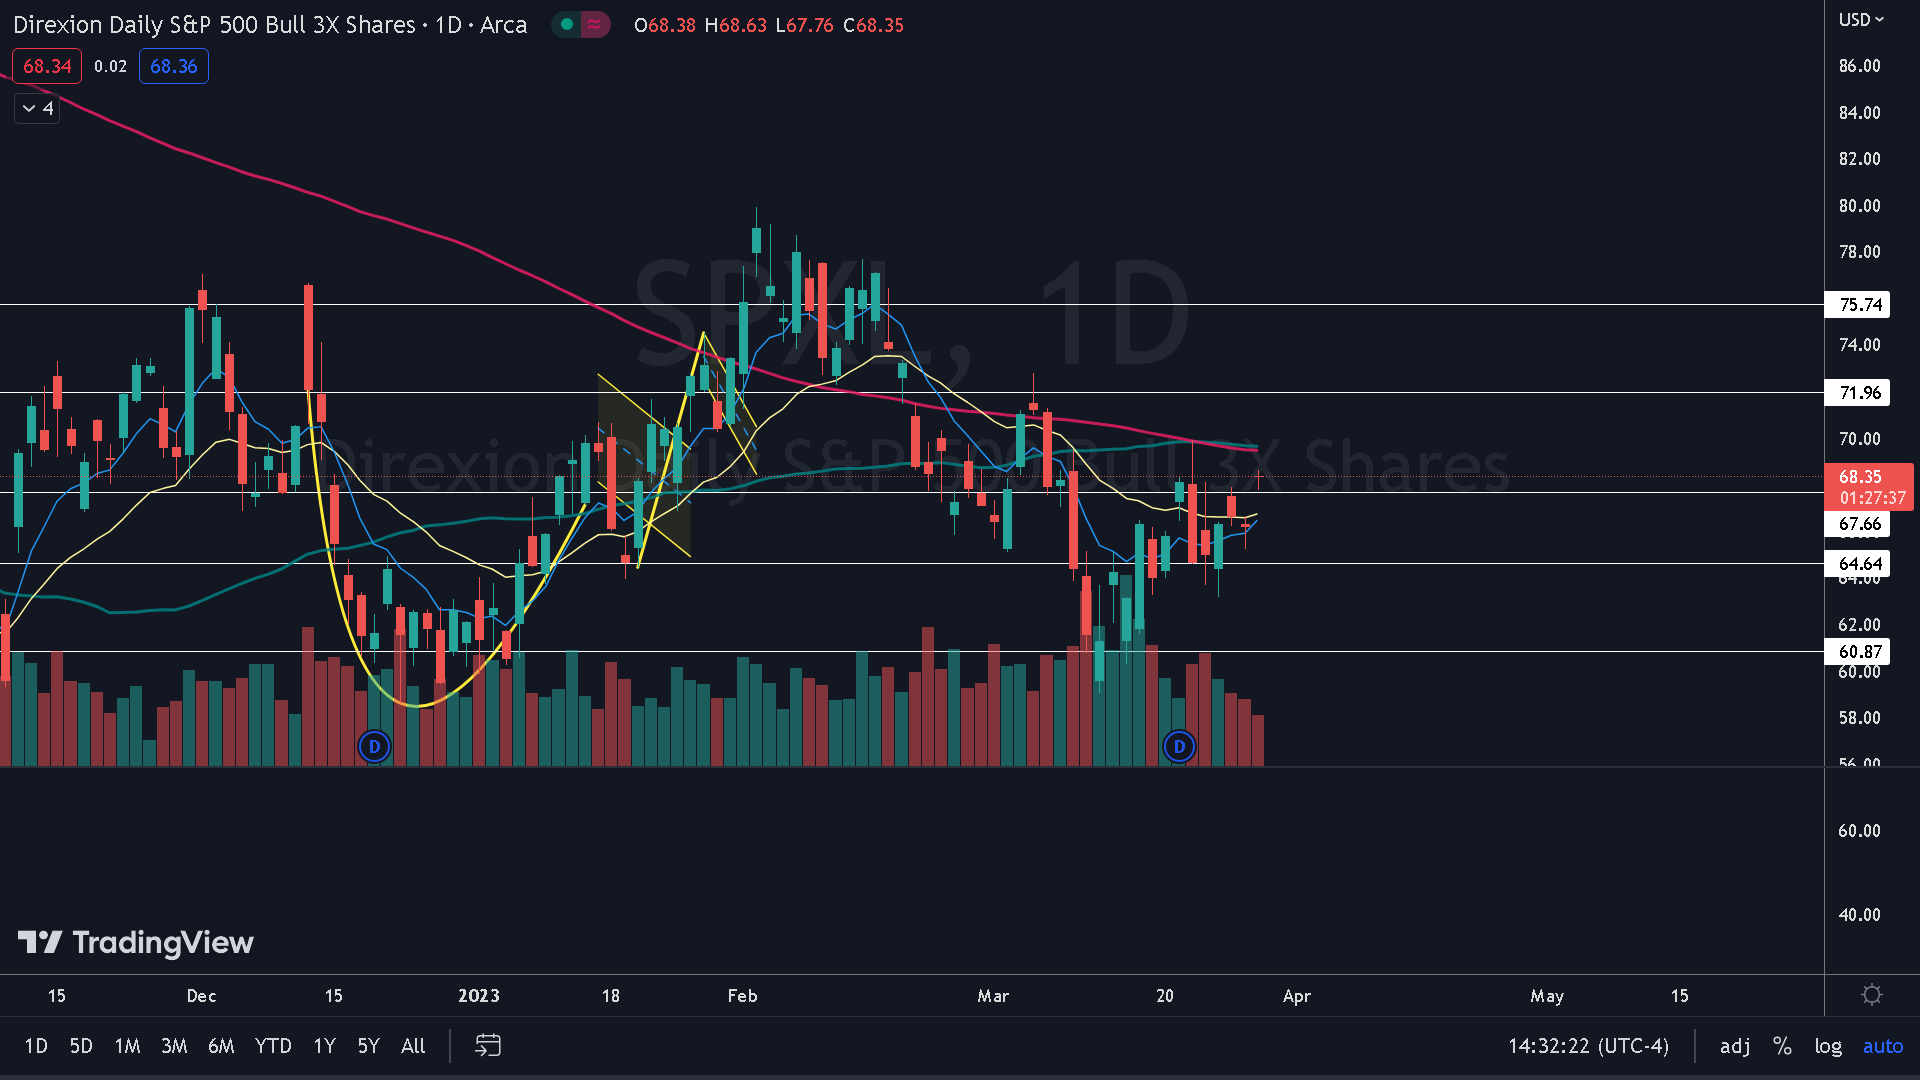
The SPXL Chart: SPXL gapped up 3.26% on Wednesday and confirmed a new uptrend. The ETF’s most recent higher low was formed on Tuesday at $65.24 and the most recent confirmed higher high was printed at the $67.90 mark on Monday.
- On Wednesday, SPXL was working to print a doji candlestick, which when found in an uptrend can signal a retracement to the downside is on the horizon. If that occurs, bullish traders can watch for a bullish reversal candlestick, such as another doji or hammer candlestick, to form, which could indicate the next local bottom is in and the ETF will rebound to form another higher high over the next few days.
- If SPXL continues in its uptrend and reaches the 200-day simple moving average (SMA), it may find temporary resistance at that level. Bullish traders will want to see the ETF consolidate under the 200-day SMA for a period of time before breaking above the area on higher-than-average volume.
- SPLX has resistance above at $71.96 and $75.74 and support below at $67.66 and $64.64.
Photo via Shutterstock.
Edge Rankings
Price Trend
© 2025 Benzinga.com. Benzinga does not provide investment advice. All rights reserved.
Trade confidently with insights and alerts from analyst ratings, free reports and breaking news that affects the stocks you care about.
 Read Next: