


Zinger Key Points
- The SPY is trading in an inside bar pattern and may be forming a bull flag pattern.
- Due to the technical patterns, the market ETF could be in for more upside this week.
- Feel unsure about the market’s next move? Copy trade alerts from Matt Maley—a Wall Street veteran who consistently finds profits in volatile markets. Claim your 7-day free trial now.
The stock market was closed on Friday for Good Friday, a Christian holiday that commemorates the crucifixion of Jesus Christ. Last week, at sunset on April 5, the Jewish holiday of Passover also began, which will end on Thursday.
But how does the stock market typically perform in the week following the long Easter weekend?
The week following Easter weekend in 2022, the SPDR S&P 500 SPY lost 2.68% after declining 7.89% over the course of that year to date. The year prior, the market ETF rose 2.7%, during the week beginning April 5, after gaining 7.15% from the beginning of the year into the Easter weekend.
In 2020, following the onset of the COVID-19 pandemic, the SPY rose 3.3% over the week following Easter, after declining almost 13.56% over that year heading into the holiday. Going back to 2019, the SPY edged 1.38% higher the week following the long weekend.
Want direct analysis? Find me in the BZ Pro lounge! Click here for a free trial.
The SPY Chart: The SPY opened lower on Monday but ran into a group of buyers who caused the broad market ETF to rise from its low-of-day. The trading action caused the SPY to print an inside bar pattern on the daily chart.
- The pattern leans slightly bullish in this case because the SPY was trading mostly higher before forming the pattern, but traders can watch for the ETF to break up or down from Friday’s mother bar on higher-than-average volume to confirm future direction.
- The SPY could also be settling into a bull flag pattern on the daily chart, with the pole formed between March 23 and April 4 and the flag being created over the trading days that have followed. The measured move, if the pattern is recognized, is about 6%, which suggests the ETF could spike up toward $430 in the future.
- Bullish traders want to see the SPY break up from the inside bar pattern and the bull flag on higher-than-average volume, which could indicate a longer-term upswing is on the horizon. Bears want to see the SPY close a trading session under the eight-day exponential moving average, which will negate the bull flag and could accelerate a move to the downside.
- The SPY has resistance above at $414.89 and $420.76 and support below at $408 and $404.
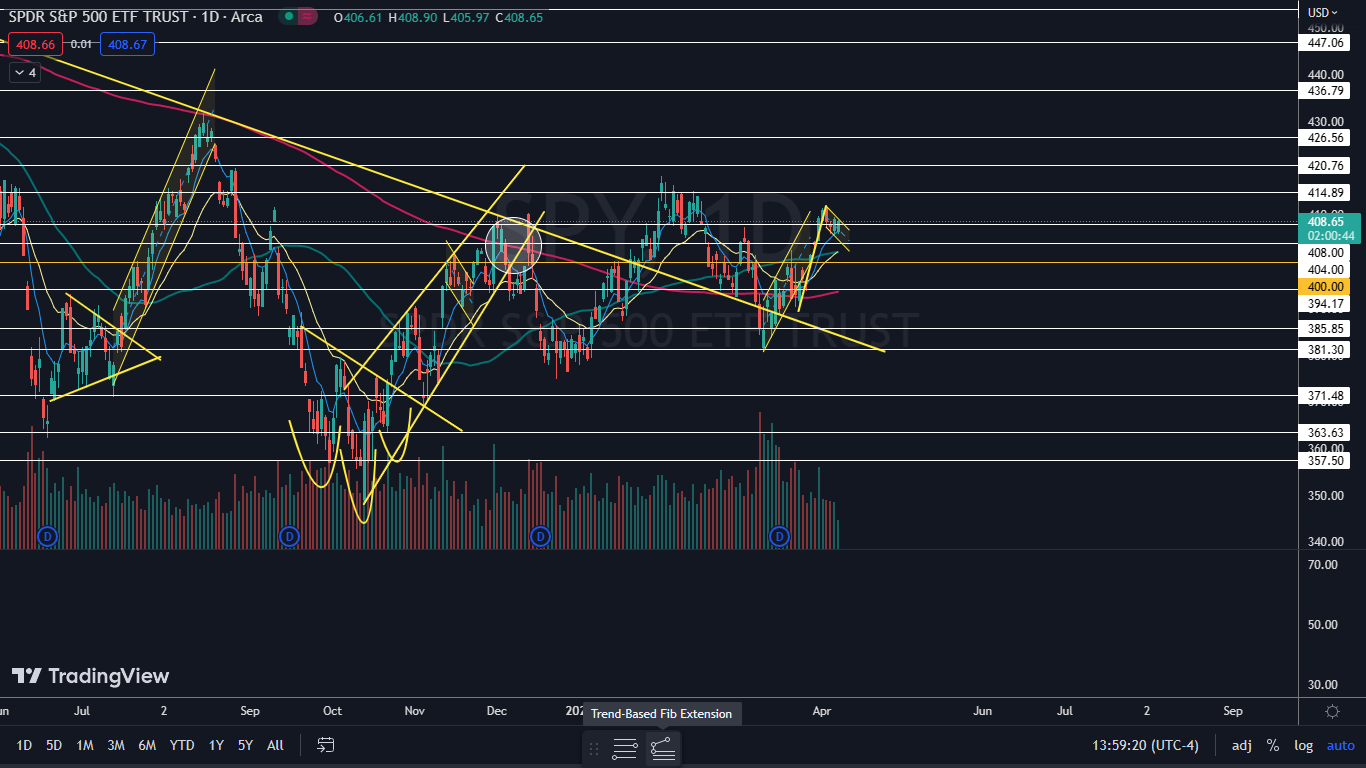
Photo: Unsplash
Edge Rankings
Price Trend
© 2025 Benzinga.com. Benzinga does not provide investment advice. All rights reserved.
Trade confidently with insights and alerts from analyst ratings, free reports and breaking news that affects the stocks you care about.

