Zinger Key Points
- SOXL is a triple-leveraged fund that consists of a variety of stocks in the semiconductor sector.
- The ETF regained the 200-day SMA on Friday, indicating a bull cycle could be on the horizon.
- China’s new tariffs just reignited the same market patterns that led to triple- and quadruple-digit wins for Matt Maley. Get the next trade alert free.
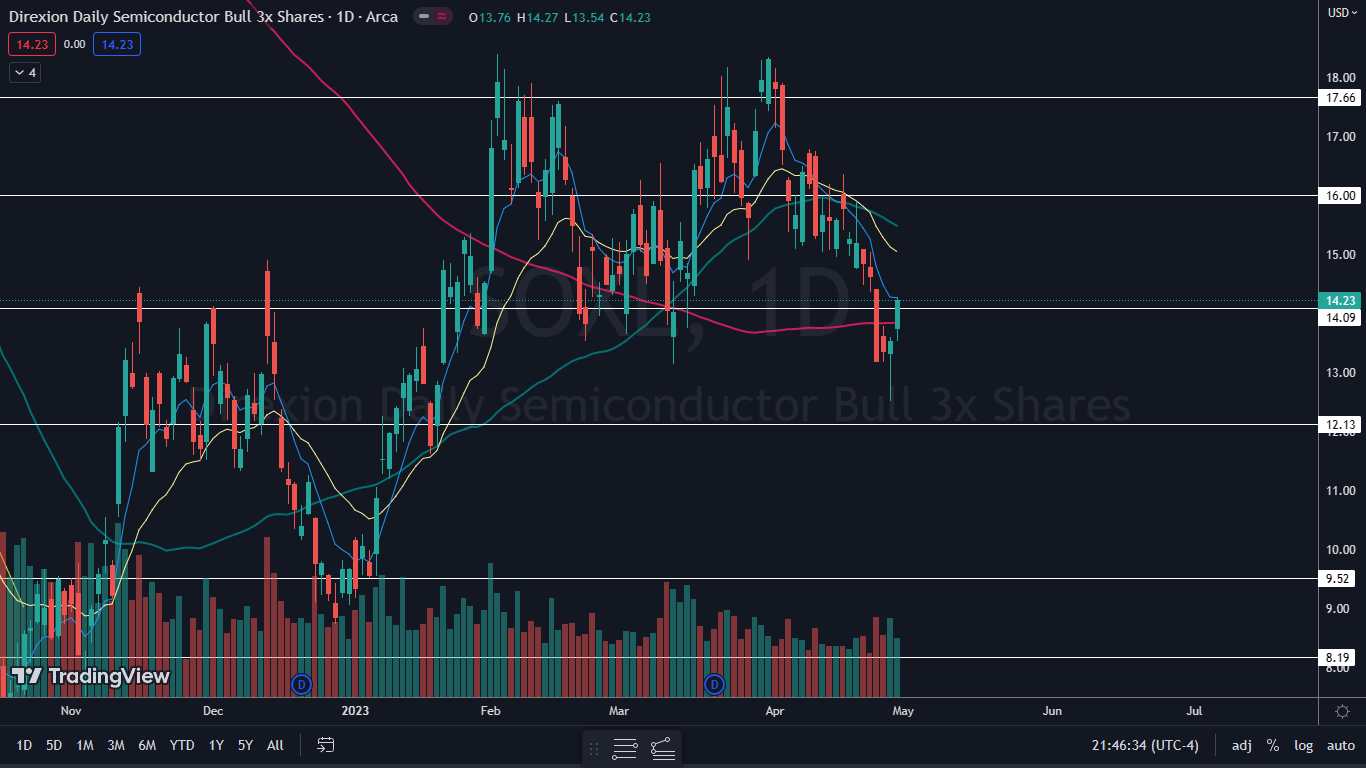
Direxion Daily Semiconductor Bull 3X Shares SOXL rebounded over 5% higher last Friday to close the trading session above the 200-day simple moving average (SMA).
Although the semiconductor sector has seen a steep drop since March 31, SOXL’s recent reversal could provide a solid trade for investors with a high risk-reward appetite. SOXL is a triple-leveraged fund that consists of a variety of stocks in the semiconductor sector. Advanced Micro Devices, Inc AMD makes up 7.03% of the fund, while NVIDIA Corporation NVDA is weighted at 8.81%.
Tech stocks, including chipmaker stocks, have enjoyed bullish price action recently, matching the positive movements seen in the general markets. On Friday, the S&P 500 broke through heavy resistance near $414, suggesting that the stock market could be headed higher.
Traders who are bearish on the semiconductor sector can track the Direxion Daily Semiconductor Bear 3X Shares SOXS.
Want direct analysis? Find me in the BZ Pro lounge! Click here for a free trial.
The SOXL Chart: After printing a bullish hammer candlestick pattern on Thursday, SOXL shot higher on Friday to close near the high-of-day, suggesting higher prices could come on Monday.
- The ETF, however, could also trade sideways and print an inside-bar pattern on Monday, which would lean bullish for continuation. Eventually, SOXL would have to retrace to print at least a higher low, which would confirm a new uptrend and provide a possible solid entry point for traders who aren’t already in the position.
- When SOXL eventually retraces lower, the stock may find support at the 200-day SMA. Traders can then wait for the ETF to print a possible reversal candlestick pattern, such as a doji candle or hammer candlestick pattern, above the area. If SOXL drops below that level, however, bearish traders may gain control.
- SOXL has resistance above $16 and $17.66 and support below $14.09 and $12.13.

Read Next: Is The SPY Headed For A Bull Cycle? This Fund Offers 3X Leverage: Quick Take Technical Analysis
Edge Rankings
Price Trend
© 2025 Benzinga.com. Benzinga does not provide investment advice. All rights reserved.
Trade confidently with insights and alerts from analyst ratings, free reports and breaking news that affects the stocks you care about.