


Zinger Key Points
- Tesla printed a bullish kicker candlestick on Friday, indicating higher prices may be on the horizon.
- The stock found resistance at the lower range of an upper gap that was the result of a bearish reaction to Tesla's earnings.
- China’s new tariffs just reignited the same market patterns that led to triple- and quadruple-digit wins for Matt Maley. Get the next trade alert free.
Tesla, Inc TSLA was trading over 2% higher in the premarket on Monday after closing Friday’s session up 5.5%.
After a months-long series of price cuts across its models to boost demand, the Austin, Texas-based company has begun raising the prices of some of its vehicles in the U.S., China, Japan and Canada.
The move comes following Tesla’s first-quarter earnings, which had worse-than-expected margins due to its slashing the prices of its electric vehicles.
Want direct analysis? Find me in the BZ Pro lounge! Click here for a free trial.
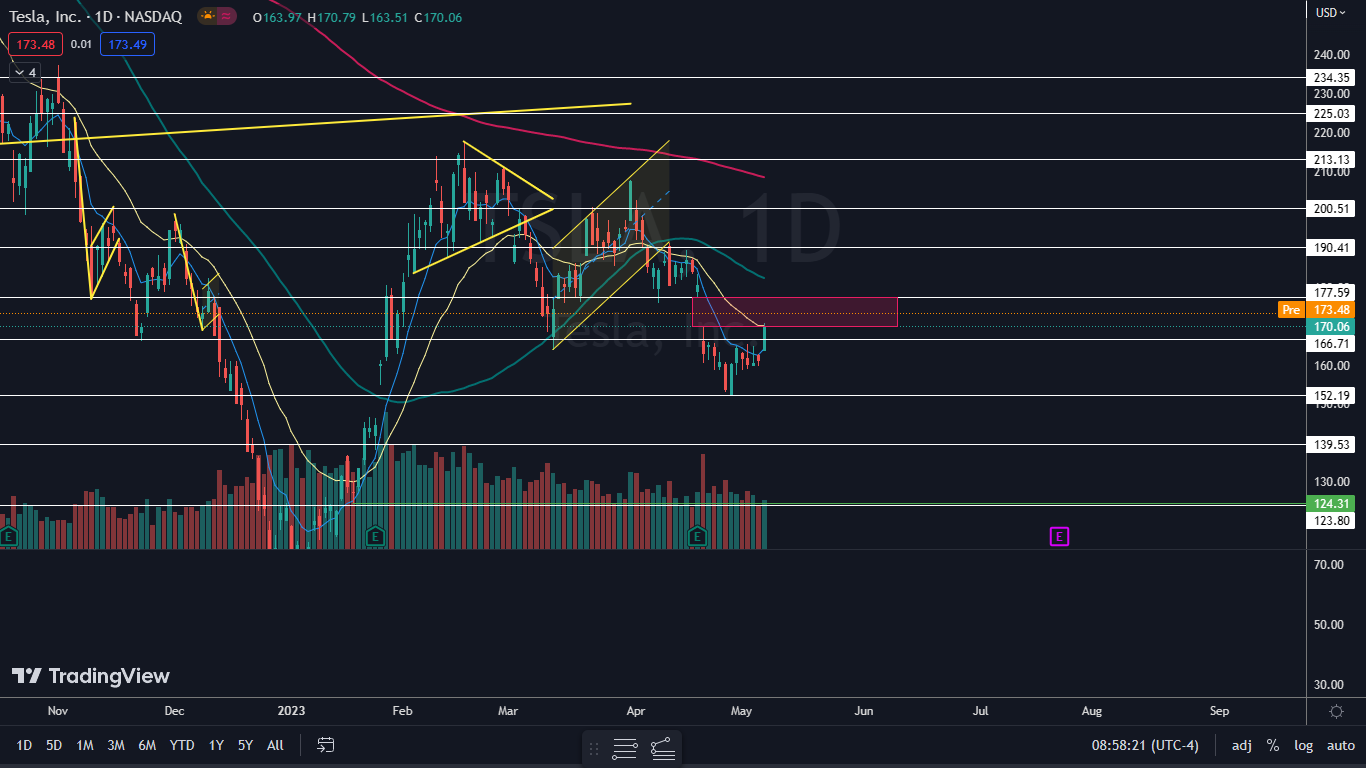
Friday’s move higher caused Tesla to print a bullish kicker candlestick pattern and hit the lower range of a gap that was left behind on April 20, the day following its earnings print. In the premarket, Tesla was moving up into the empty trading range.
A bullish kicker candlestick pattern consists of two candles, where the first candlestick is bearish and the second candlestick is bullish, beginning with a gap higher and followed by the stock closing near the high-of-day. The pattern is a strong indicator of a bullish reversal in trader and investor sentiment and can be followed by higher prices, a second bullish kicker candlestick or sideways consolidation.
Candlestick patterns can be used to indicate the future price direction of a stock. Candlestick patterns are especially useful for technical traders when they are combined with other indicators such as larger patterns, trading volume, relative strength index (RSI) and divergences between RSI and price action.
The Tesla Chart: Tesla reversed into an uptrend on April 27, when the stock bounced up from near the $152 mark. The EV giant’s most recent higher low was formed on Thursday at $159.65 and the most recent confirmed higher high was printed at the $165.49 mark on May 2.
- On Friday, Tesla completed a bullish kicker candlestick pattern, indicating higher prices are likely to come on Monday. If that happens, Tesla may completely fill the gap that exists between $169.70 and $177.65, where the stock could find resistance at least temporarily.
- Bearish traders can watch for Tesla to form a bearish reversal candlestick near the upper range of the gap, which could indicate lower prices, at least on smaller time frames, are likely in the cards. Bullish traders want to see Tesla break up through the upper range of the gap, which could cause the stock to trade up toward $183, where resistance at the 50-day simple moving average is likely.
- Tesla has resistance above at $177.59 and $190.41 and support below at $166.71 and $152.19.
 Next: Tesla, Meta, Amazon: Crucial Trading Levels This Week
Photo: Shutterstock
Edge Rankings
Price Trend
© 2025 Benzinga.com. Benzinga does not provide investment advice. All rights reserved.
Trade confidently with insights and alerts from analyst ratings, free reports and breaking news that affects the stocks you care about.

