Zinger Key Points
- While the S&P 500 and the VIX usually show an inverse correlation, both were rising slightly Monday.
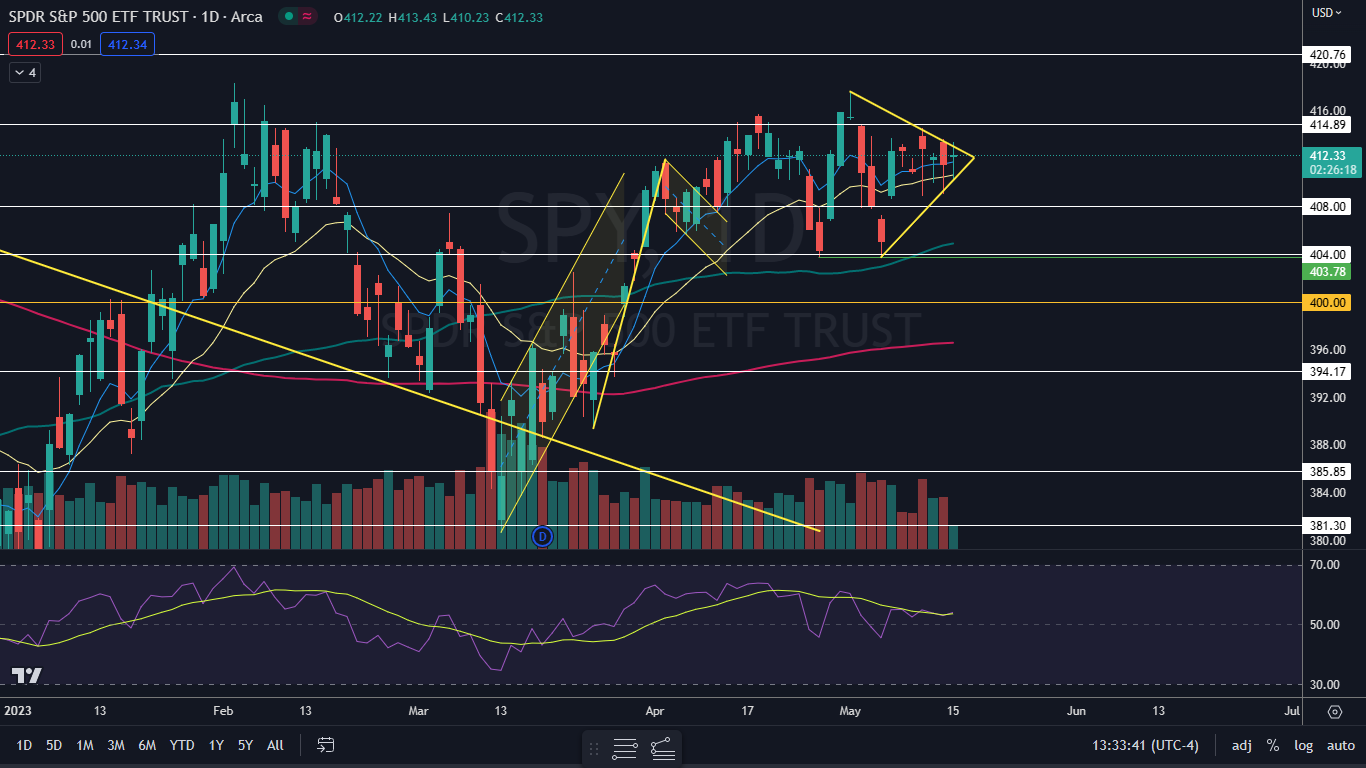
- The S&P 500 is set to reach the apex of a triangle on Wednesday, which could increase volatility in the market.
- Join Chris Capre on Sunday at 1 PM ET to learn the short-term trading strategy built for chaotic, tariff-driven markets—and how to spot fast-moving setups in real time.
The CBOE Volatility Index opened over 2% higher on Monday, in tandem with the S&P 500 Index, which was edging up about 0.2% amid the likelihood of a recession continuing to increase.
While the S&P 500 and the VIX are usually inversely correlated, they sometimes move in tandem with each other. Because the S&P 500 and the VIX were both moving north on Monday, it may indicate the market is getting ready to make a big move in one direction, but traders are unsure of whether the direction will be bullish or bearish.
The VIX is used to measure the expectation of near-term volatility in the stock market, and volatility is used to gauge market sentiment, specifically the level of fear that exists in the S&P 500.
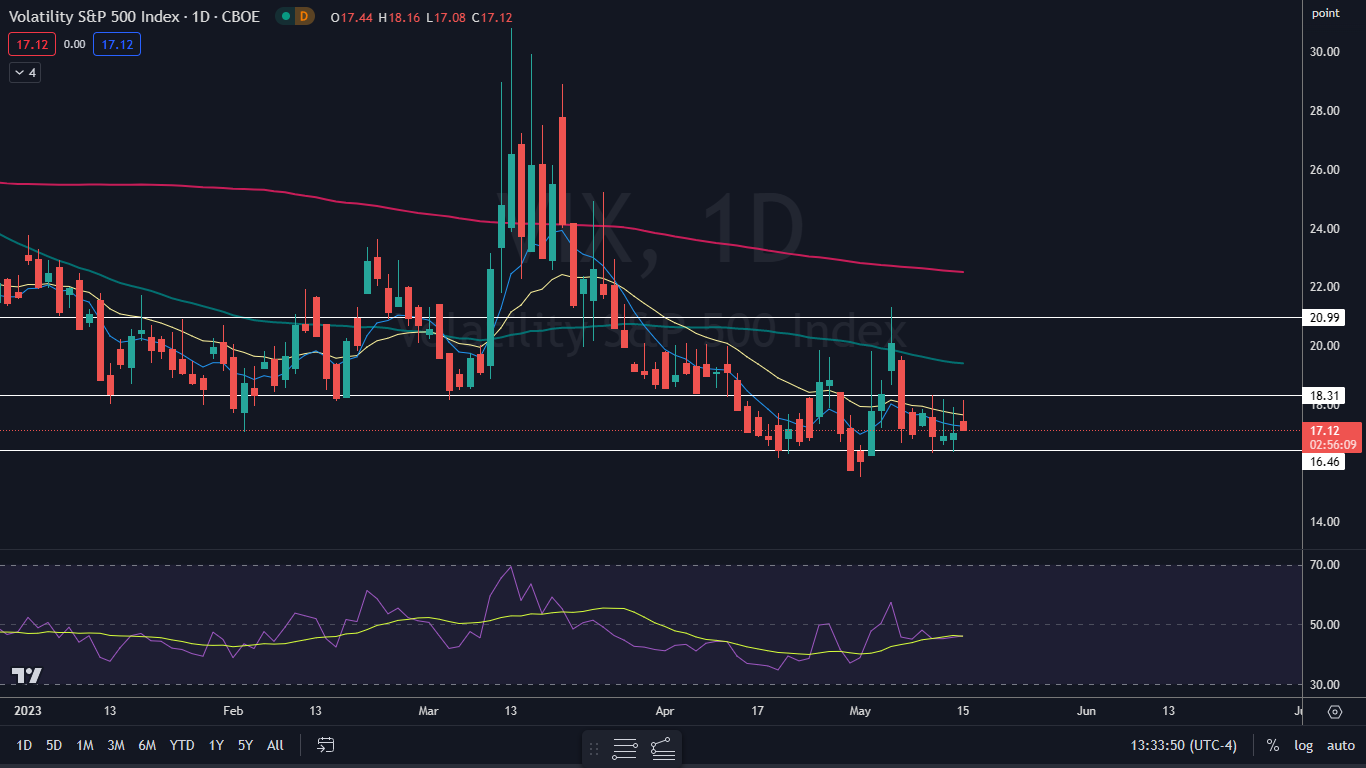
With the S&P 500 currently trading in a triangle pattern, set to meet the apex on Wednesday, the index may choose a direction before that date, which could increase volatility. If the S&P 500 breaks down from the pattern, the VIX is likely to surge higher and if the market ETF breaks up from the formation, the VIX is likely to fall lower and break down under support at $16.46.
Traders wishing to trade the volatility in the stock market can use Miax’s SPIKES Volatility products. The products, which are traded on SPIKES Volatility Index (SPIKE), track expected volatility in the SPDR S&P 500 SPY over the next 30 days.
Want direct analysis? Find me in the BZ Pro lounge! Click here for a free trial.
The SPY Chart: The S&P 500 was attempting to break up from the upper descending trend line of the triangle on Monday, but on lower-than-average volume, which was holding the market ETF back. The S&P 500 has tested the upper and lower trend lines of the triangle seven times since the pattern began to form on May 1 but has failed to break bullishly or bearishly.
Both bullish and bearish traders can watch for the S&P 500 to break from the triangle on higher-than-average volume to indicate the pattern was recognized and to gauge future direction.

The VIX Chart: The VIX has been trading mostly sideways since May 8, holding above 16.46 but unable to break above 18.31. Depending on which way the S&P 500 breaks from the triangle will likely determine whether the VIX finally breaks from its sideways trading pattern.

Edge Rankings
Price Trend
© 2025 Benzinga.com. Benzinga does not provide investment advice. All rights reserved.
Trade confidently with insights and alerts from analyst ratings, free reports and breaking news that affects the stocks you care about.