
Zinger Key Points
- Tesla rejected and wicked down from the 200-day SMA on Friday.
- The stock is trading in a rising channel pattern on the daily chart, making a series of higher highs and higher lows.
- The new Benzinga Rankings show you exactly how stocks stack up—scoring them across five key factors that matter most to investors. Every day, one stock rises to the top. Which one is leading today?
Tesla, Inc TSLA was trading almost 4% higher in the premarket Tuesday following news President Joe Biden and House Speaker Kevin McCarthy had reached a tentative agreement to raise the debt ceiling for two years.
On Friday, Tesla attempted to regain the 200-day simple moving average (SMA) as support but failed and wicked down from the area. In the premarket Tuesday, Tesla was attempting to open the trading day above the area.
The 200-day SMA is an important bellwether. Technical traders and investors consider a stock trading above the level on the daily chart to be in a bull cycle, whereas a stock trading under the 200-day SMA is considered to be in a bear cycle.
The 50-day SMA also plays an important role in technical analysis, especially when paired with the 200-day. When the 50-day SMA crosses below the 200-day SMA, a death cross occurs, whereas when the 50-day SMA crosses above the 200-day, a bullish golden cross takes place.
If Tesla begins to fall in tandem with the general market, volatility could increase. Traders wishing to trade the volatility in the stock market can use MIAX’s SPIKES Volatility products. The products, which are traded on SPIKES Volatility Index (SPIKE), track expected volatility in the SPDR S&P 500 over the next 30 days.
Want direct analysis? Find me in the BZ Pro lounge! Click here for a free trial.
The Tesla Chart: Tesla is likely to consolidate under the 200-day SMA for at least a short period of time because it’s rare for a stock to regain the area on the first attempt. Tesla’s move up to the area on Friday came on higher-than-average volume, however, which indicates the bulls are in control.
- Tesla is trading in an uptrend within a rising channel pattern, with the most recent higher high formed on Friday at $198.60 and the most recent higher low printed at the $178.22 mark on May 24. If Tesla falls lower on Tuesday, bullish traders want to see the stock create a reversal candlestick, such as a doji or hammer candlestick, above $179, which could offer a solid entry point.
- Bearish traders want to see big bearish volume come in and drop Tesla down toward the lower ascending trendline of the pattern. If the bears can gain enough power to cause Tesla to fall through the channel pattern, a longer-term downtrend could be on the horizon.
- Tesla has resistance above at $200.51 and $213.13 and support below at $190.41 and $177.59.
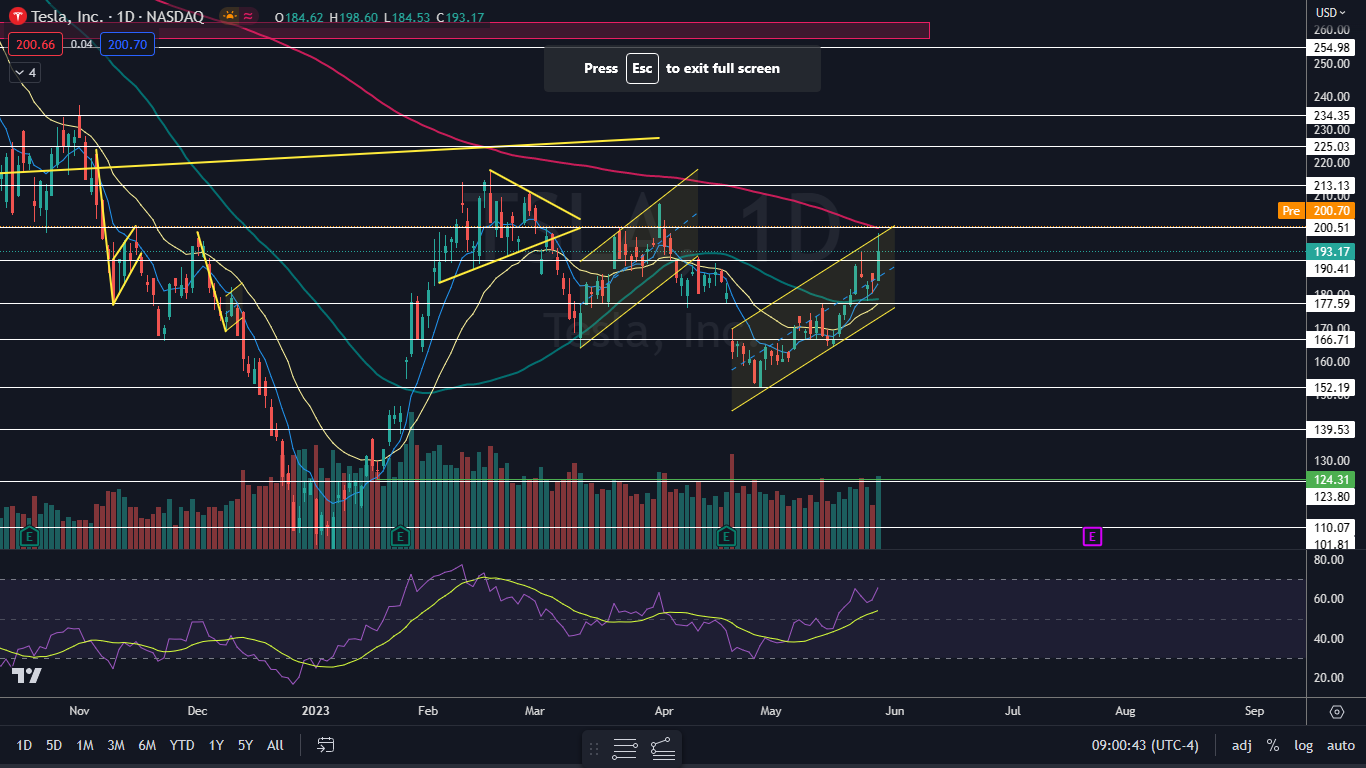
Photo: Shutterstock
Edge Rankings
Price Trend
© 2025 Benzinga.com. Benzinga does not provide investment advice. All rights reserved.
Trade confidently with insights and alerts from analyst ratings, free reports and breaking news that affects the stocks you care about.

