Zinger Key Points
- Tesla is trading in an uptrend, making higher highs and higher lows.
- A pull back is likely to come soon because Tesla's RSI is trending in overbought territory.
- Feel unsure about the market’s next move? Copy trade alerts from Matt Maley—a Wall Street veteran who consistently finds profits in volatile markets. Claim your 7-day free trial now.
Tesla, Inc TSLA closed Friday’s session 3.11% higher, in tandem with the general market, which saw the S&P 500 rally 1.45%.
The move came ahead of the company’s announcment that all Model 3 vehicles in the U.S. now qualify for the full EV tax credit of $7,500, where before, only some of the vehicle line qualified for the full amount.
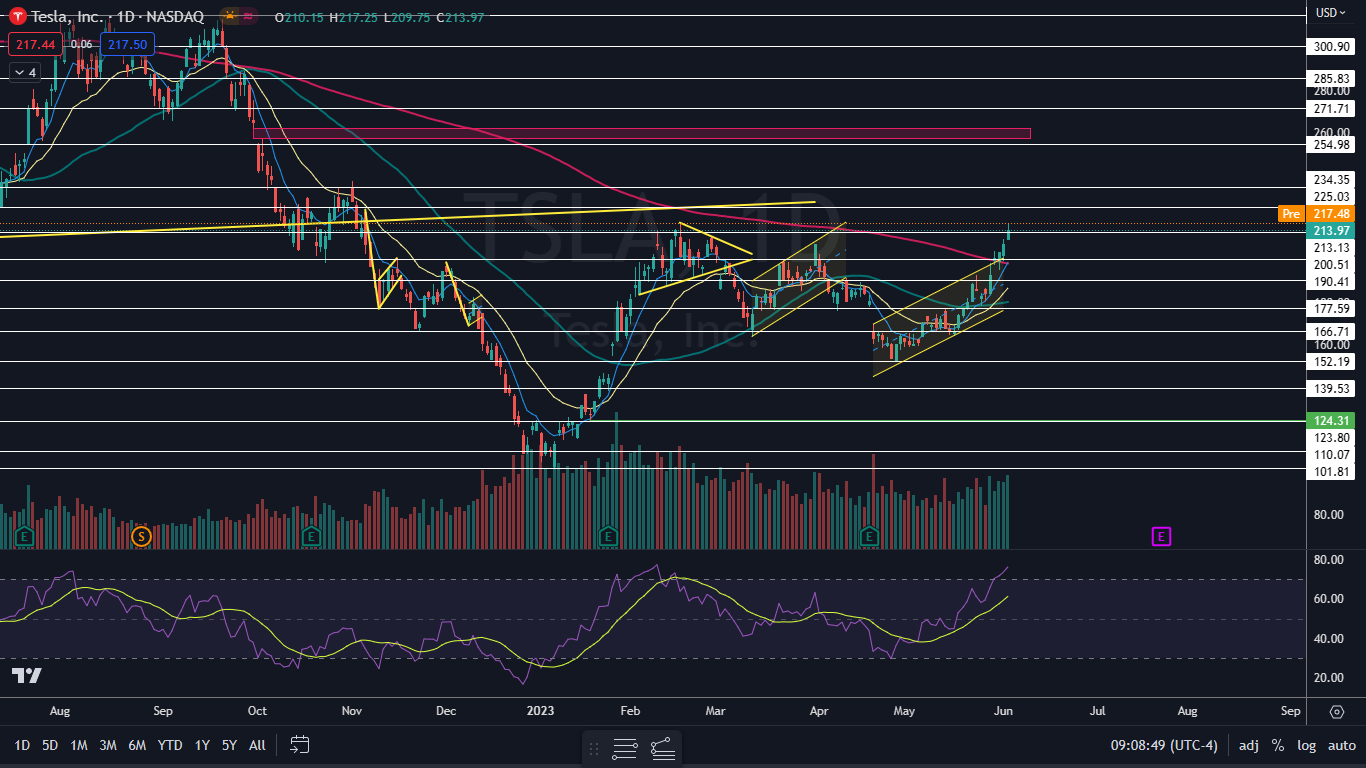
Regardless of the news, Tesla has been trading in a strong uptrend, but on Friday, the stock formed a reversal candlestick, which suggests a retracement is on the horizon. An uptrend occurs when a stock consistently makes a series of higher highs and higher lows on the chart.
The higher highs indicate the bulls are in control while the intermittent higher lows indicate consolidation periods.
Traders can use moving averages to help identify an uptrend, with rising lower time frame moving averages (such as the eight-day or 21-day exponential moving averages) indicating the stock is in a steep shorter-term uptrend.
Rising longer-term moving averages (such as the 200-day simple moving average) indicate a long-term uptrend.
Want direct analysis? Find me in the BZ Pro lounge! Click here for a free trial.
The Tesla Chart: Tesla was rising about 1.7% higher in the premarket Monday, attempting to break above Friday’s high-of-day. If the stock is able to make a new high within its uptrend on higher-than-average volume, traders can watch for the stock to pull back later in the week.
- If Tesla is unable to break to a new high, the stock may trade in an inside bar pattern, which would lean bullish for continuation on Tuesday. If Tesla breaks down under Friday’s low-of-day, the local top will have occurred and a bigger pull back could be on the horizon.
- A pull back, at least to print another higher low, is likely to come over the next few days because Tesla’s relative strength index (RSI) is measuring in at 75%. When a stock’s RSI reaches or exceeds the 70% mark it becomes overbought, which can be a sell signal for technical traders.
- Tesla has resistance above at $225.03 and $234.35 and support below at $213.13 and $200.51.
 Read Next: Tesla Powers Ahead As Made-In-China Sales Surge 142% In May
Photo courtesy of Tesla.
Edge Rankings
Price Trend
© 2025 Benzinga.com. Benzinga does not provide investment advice. All rights reserved.
Trade confidently with insights and alerts from analyst ratings, free reports and breaking news that affects the stocks you care about.