Zinger Key Points
- MicroVision is trading in an uptrend and is due for a higher low.
- The stock's RSI is measuring in at over 90%, which suggests a pullback is on the horizon.
- Our government trade tracker caught Pelosi’s 169% AI winner. Discover how to track all 535 Congress member stock trades today.
MicroVision, Inc MVIS surged over 15% at one point Wednesday morning after closing Tuesday’s session up 30.39%, possibly as a result of a short squeeze.
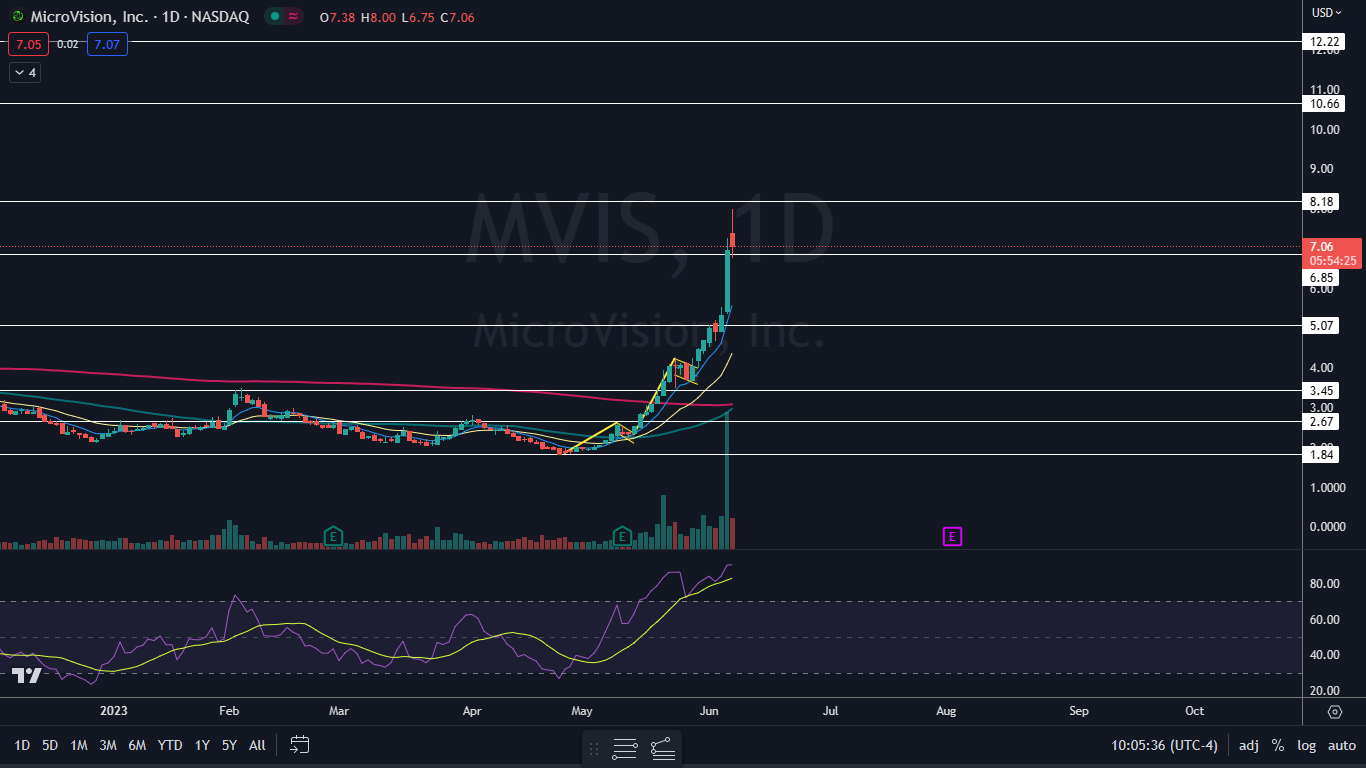
The stock has soared about 240% since April 27, when MicroVision bounced off support at $1.82 and created a double bottom pattern at that level. Since then, MicroVision has formed two bull flags that were recognized and confirmed the stock is trading in an uptrend.
An uptrend occurs when a stock consistently makes a series of higher highs and higher lows on the chart.
The higher highs indicate the bulls are in control while the intermittent higher lows indicate consolidation periods.
Traders can use moving averages to help identify an uptrend, with rising lower time frame moving averages (such as the eight-day or 21-day exponential moving averages) indicating the stock is in a steep shorter-term uptrend.
Rising longer-term moving averages (such as the 200-day simple moving average) indicate a long-term uptrend.
Want direct analysis? Find me in the BZ Pro lounge! Click here for a free trial.
The MicroVision Chart: MicroVision hasn’t formed a higher low on the daily chart since May 23, which suggests a retracement lower is likely on the horizon. The stock’s relative strength index (RSI) is also measuring in at about 91% and has been in overbought territory since May 15.
- When a stock’s RSI exceeds 70% it can be a sell signal for technical traders, although it should be noted that RSI levels can remain extended to both the upside and the downside for long periods of time. Traders wanting to enter may choose to wait for a pullback, which will eventually take place.
- MicroVision’s 50-day simple moving average (SMA) is likely to cross above the 200-day SMA over the next few trading days, which will cause a golden cross to form. The stock has become extended from the eight-day exponential moving average, and when MicroVision eventually pulls back, it may back test that level.
- MicroVision has resistance above at $8.18 and $10.66 and support below at $6.85 and $5.07.
 Read Next: The SPY Tops Out, Beginning Bullish Consolidation Pattern: What To Watch In The Stock Market
Photo via Shutterstock.
© 2025 Benzinga.com. Benzinga does not provide investment advice. All rights reserved.
Trade confidently with insights and alerts from analyst ratings, free reports and breaking news that affects the stocks you care about.