Zinger Key Points
- Nio was trading higher within an inside bar pattern on Monday, attempting to regain the 50-day SMA as support.
- The pattern leans bullish for continuation into the week.
Nio, Inc NIO was spiking up over 8% on Monday after the company announced it was slashing the prices of its vehicle models by $4,200.
The move higher came in opposition to BofA Securities, JPMorgan and Citigroup lowering their price targets, although the new price targets all came in above Nio’s current share price. Read more here...
Nio was unable to break above Friday’s high-of-day, which saw the China-based EV maker trading in an inside bar pattern.
An inside bar pattern indicates a period of consolidation and is usually followed by a continuation move in the direction of the current trend.
An inside bar pattern has more validity on larger time frames (four-hour chart or larger). The pattern has a minimum of two candlesticks and consists of a mother bar (the first candlestick in the pattern) followed by one or more subsequent candles. The subsequent candle(s) must be completely inside the range of the mother bar and each is called an "inside bar."
A double, or triple inside bar can be more powerful than a single inside bar. After the break of an inside bar pattern, traders want to watch for high volume for confirmation the pattern was recognized.
Want direct analysis? Find me in the BZ Pro lounge! Click here for a free trial.
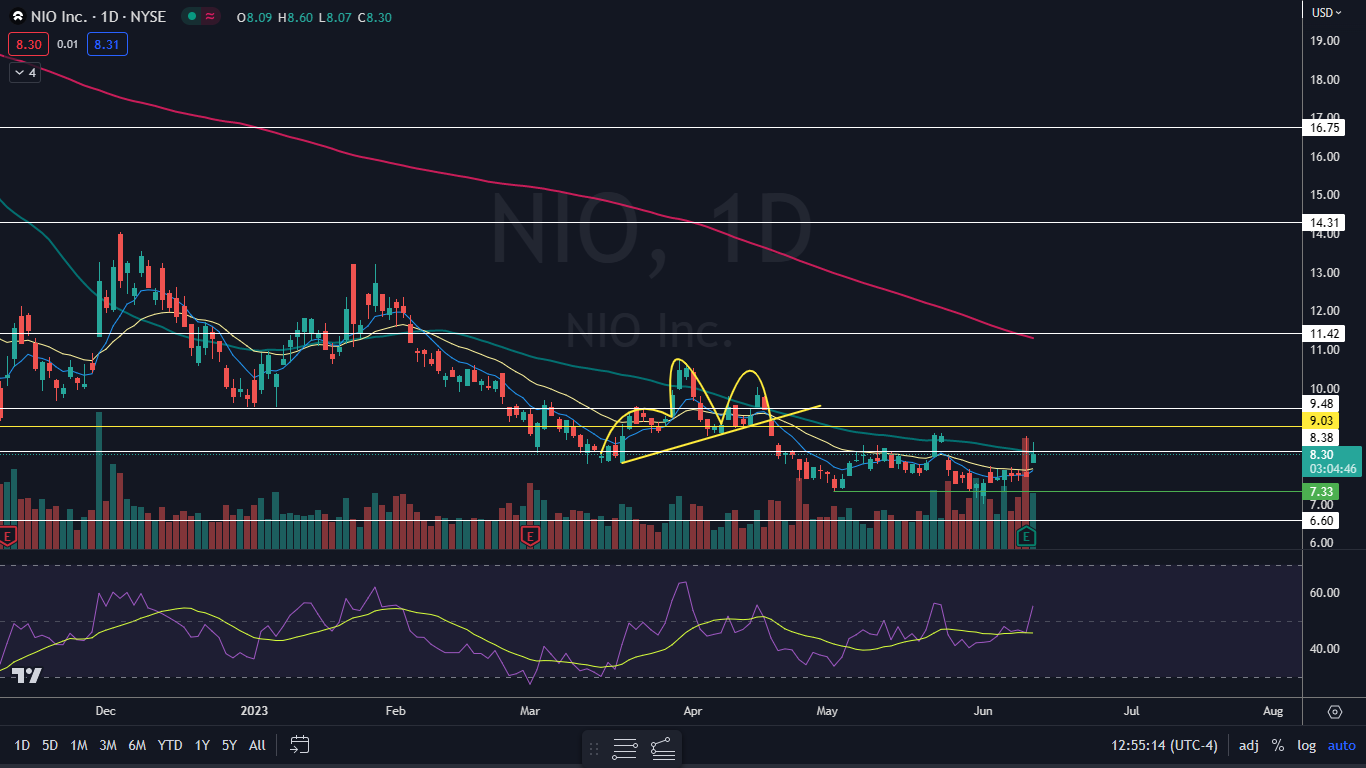
The Nio Chart: Nio’s inside bar pattern leans bullish because the stock is trading in an uptrend. Traders and investors can watch for the stock to break up or down from Friday’s mother bar later on Monday or on Tuesday on higher–than–average volume to indicate the pattern was recognized and gauge the future direction.
- Nio reversed into an uptrend on June 1 and has since made a series of higher highs and higher lows. The most recent higher high was formed on Friday at $8.75 and the most recent higher low was printed at the $7.30 mark on June 6.
- On Monday, Nio was attempting to regain the 50-day simple moving average (SMA) as support, which the stock rejected on Friday. If Nio can eventually close a trading day above that area, it will give bullish traders more confidence going forward.
- If Nio ends the trading day around its peak price, the stock will display a bullish Marubozu candlestick pattern. This could suggest a potential surge in prices and a breakout from the inside bar may occur on Tuesday. If the stock closes the trading session under the 50-day SMA, Nio will form a shooting star candlestick, which could indicate lower prices are sideways consolidation is on the horizon.
- Nio has resistance above at $8.38 and $9.48 and support below at $7.33 and $6.60.

Read Next: Nio Caves In And Joins The Price-Cut War Despite CEO's Pledge
Photo: Nio
© 2025 Benzinga.com. Benzinga does not provide investment advice. All rights reserved.
Trade confidently with insights and alerts from analyst ratings, free reports and breaking news that affects the stocks you care about.