NVIDIA Corporation NVDA was trading slightly lower in the premarket Wednesday following a report that President Joe Biden plans to announce that his administration will limit the access of Chinese companies to U.S. cloud-computing services.
The chipmaker, whose stock has surged approximately 185% since the onset of 2023, recently experienced a pullback from its all-time high close to $440. This came in the wake of heightened tensions between the U.S. and China, as the U.S. aims to curb China's progress in the field of artificial intelligence.
On Monday, Nvidia printed a shooting star candlestick on the daily chart, which indicated lower prices were likely to come on Wednesday. The candlestick, when found following an upswing, often indicates the local top has occurred, although the next candlestick must print for confirmation.
In Nvidia’s case, the candlestick was formed on lower-than-average volume, which suggests the candlestick is weaker-than-usual.
Want direct analysis? Find me in the BZ Pro lounge! Click here for a free trial.
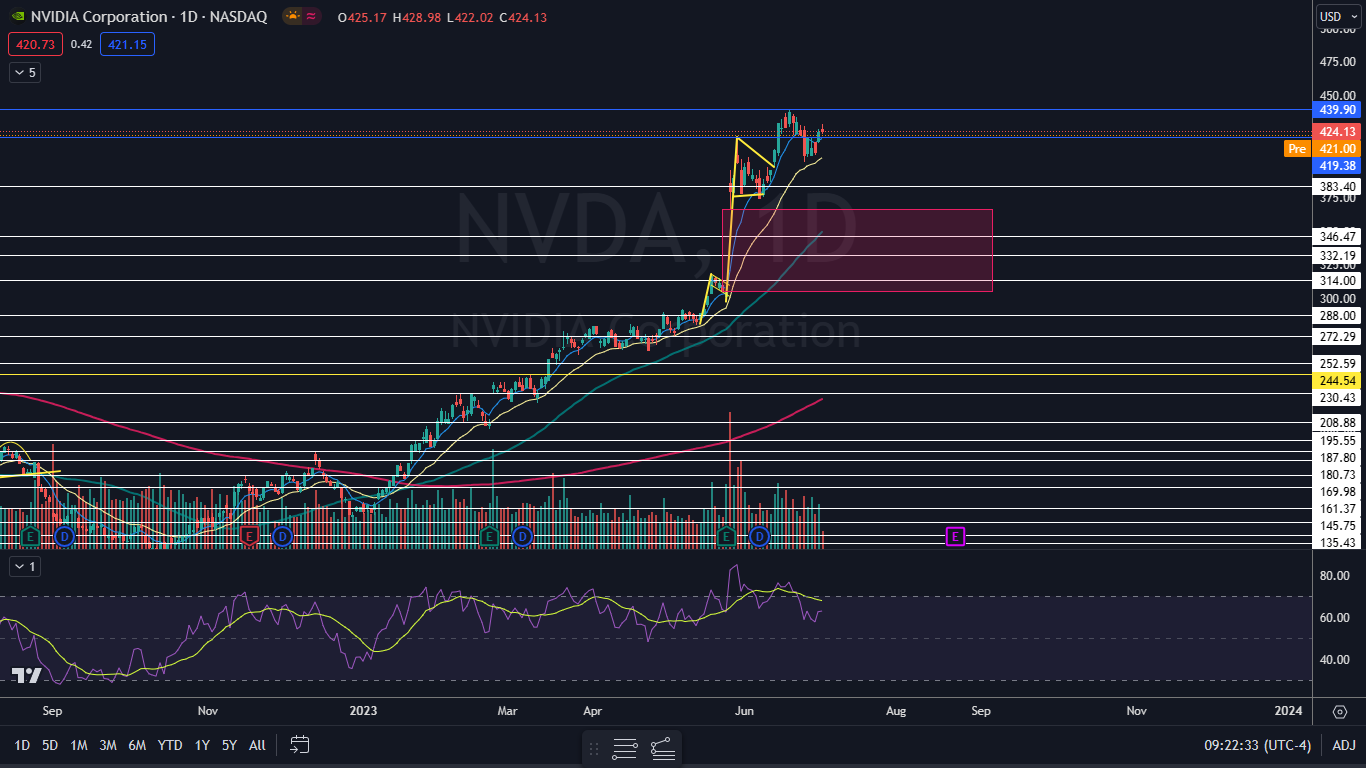
The Nvidia Chart: Nivida is trading in an uptrend, making a series of higher highs and higher lows. The most recent higher high was formed on June 20 at $439.90 and the most recent higher low was printed at the $401 mark on June 26.
- If the stock’s shooting start candlestick is confirmed, Monday’s high-of-day will serve as a lower high, which would negate the uptrend. If that happens, bullish traders will want to see Nvidia reverse before forming a lower low, while bearish traders will want to see the stock drop under $400.
- Nvidia has a gap between $306.07 and $366.35, which was formed on May 25 after the company printed a quarterly earnings beat. Gaps on charts are about 90% likely to fill in the future, although Nvidia’s gap may be a break-a-way gap, which makes it less likely to fill over the short term.
- The stock is trading slightly above the eight-day exponential moving average (EMA), with the eight-day EMA trending above the 21-day EMA, which may give bulls confidence. For short-term traders, a loss of the eight-day EMA could provide a good exit point.
- Nvidia has resistance above at the all-time high of $439.90 and at the psychologically important $450 mark and support below at $419.38 and $383.40.

Read Next: What Can Drive TSMC's Revenue Rebound? Strong Demand for AI Chips from Nvidia, Broadcom, AMD
Photo: Shutterstock
© 2024 Benzinga.com. Benzinga does not provide investment advice. All rights reserved.
Comments
Trade confidently with insights and alerts from analyst ratings, free reports and breaking news that affects the stocks you care about.