Zinger Key Points
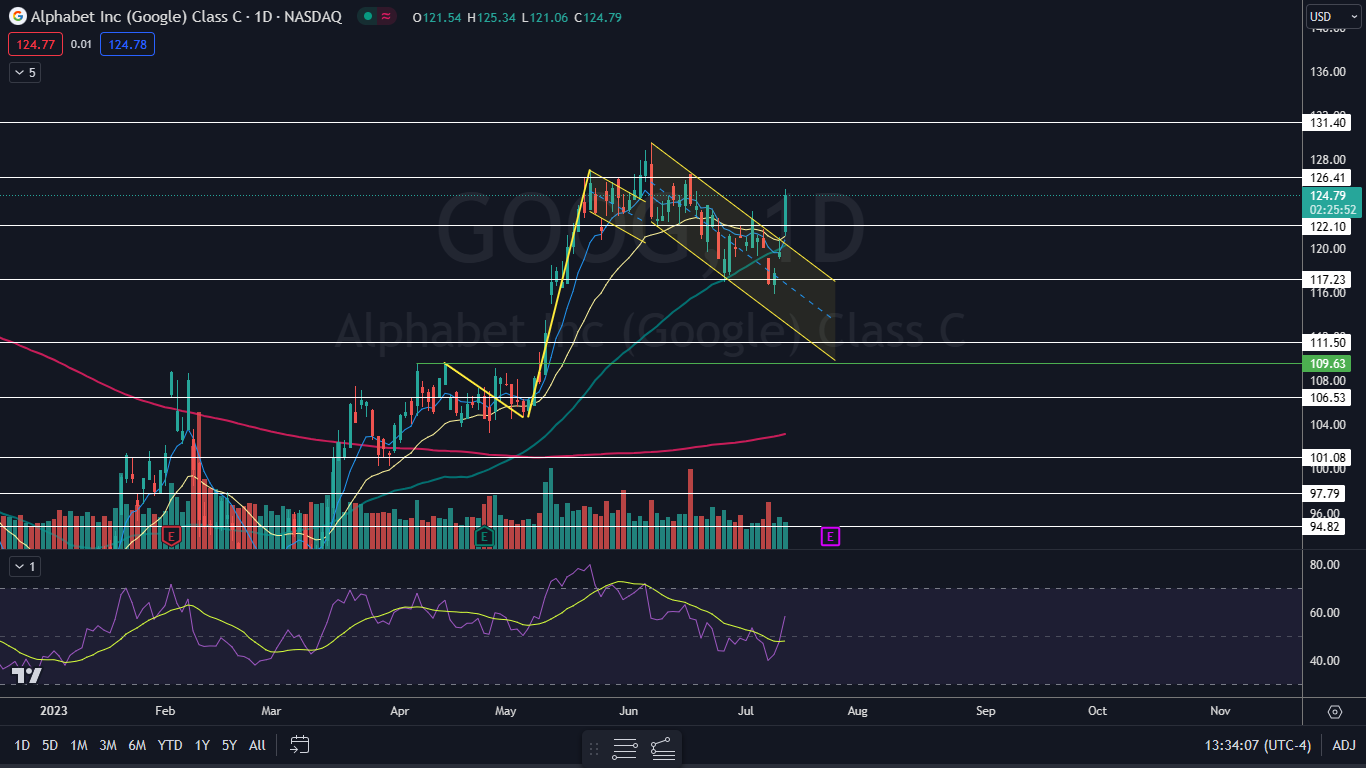
- Google negated its downtrend on Thursday by rising above the most recent lower high.
- The move higher caused the stock to break up from a descending channel pattern on the daily chart.
- Join Chris Capre on Sunday at 1 PM ET to learn the short-term trading strategy built for chaotic, tariff-driven markets—and how to spot fast-moving setups in real time.
Alphabet, Inc GOOG GOOGL was spiking up over 4% on Thursday, breaking up from a descending channel on the daily chart amid the launch of its chatbot, Bard, in Europe and Brazil.
Bard is a top rival of Microsoft-backed ChatGPT, which are both human-sounding programs that leverage generative artificial intelligence to converse with users and answer prompts.
Alphabet’s move higher caused the stock to negate its recent downtrend, which had been taking place within the channel pattern. For an uptrend to confirm, the stock will have to eventually retrace lower to print a higher low.
An uptrend occurs when a stock consistently makes a series of higher highs and higher lows on the chart.
The higher highs indicate the bulls are in control, while the intermittent higher lows indicate consolidation periods.
Traders can use moving averages to help identify an uptrend, with rising lower time frame moving averages (such as the eight-day or 21-day exponential moving averages) indicating the stock is in a steep shorter-term uptrend.
Want direct analysis? Find me in the BZ Pro lounge! Click here for a free trial.
The Alphabet (GOOG) Chart: Alphabet’s most recent confirmed high was formed on July 5 at $123.37 and the most recent low was printed at the $115.83 mark on Tuesday. On Thursday, Alphabet spiked higher than the July 5 high-of-day, which negated the downtrend.
- If Alphabet closes the trading day near its high-of-day, the stock will print a bullish kicker candlestick, which could suggest higher prices will come again on Friday. The next most likely scenario is that Alphabet will trade sideways and print an inside bar pattern to consolidate Thursday’s spike.
- Bearish traders want to see Alphabet eventually form a bearish reversal candlestick, such as a doji or shooting star candlestick, which could suggest the local top has occurred, and a retracement is on the horizon. Until Alphabet eventually negates its possible new uptrend, the stock isn’t likely to see a long-term downside.
- Alphabet has resistance above at $126.41 and $131.40 and support below at $122.10 and $117.23.

Read Next: He Quit A 6-Figure Finance Job To Make YouTube Videos: Now He's Making More Money Than Ever Before
Photo: Unsplash
Edge Rankings
Price Trend
© 2025 Benzinga.com. Benzinga does not provide investment advice. All rights reserved.
Trade confidently with insights and alerts from analyst ratings, free reports and breaking news that affects the stocks you care about.