
Zinger Key Points
- Tesla may find support near the $265 level and if it bounces from there, the stock will form a triple bottom pattern.
- The EV giant was working to print a bullish kicker candlestick, which could suggest lower prices are on the horizon.
- Get two weeks of free access to pro-level trading tools, including news alerts, scanners, and real-time market insights.
Tesla Inc TSLA was plunging more than 8% on Thursday, receiving a bearish reaction to its second-quarter financials, despite beating expectations.
Several analysts weighed in on the stock following the earnings print with four firms raising their price targets, according to data from Benzinga Pro.
Baird analyst Ben Kallo maintains Tesla as a “Best Pick” for the second half of 2023 while taking note of cautions issued by the company and Tesla’s declining margins.
While Kallo expected a pullback in Tesla based on lower volume production and the announcement of FSD transferability this quarter, the analyst sees any retracement in the stock as a buying opportunity. Read more here...
While Tesla’s steep sell-off Thursday likely concerned bullish traders, the downturn hasn’t been enough, so far, to negate the stock's uptrend. The downturn was also taking place on lower-than-average volume, which suggests the bulls remain in control.
With that being said, bullish traders looking to enter into a position may choose to wait for signs that the local bottom has occurred.
Want direct analysis? Find me in the BZ Pro lounge! Click here for a free trial.
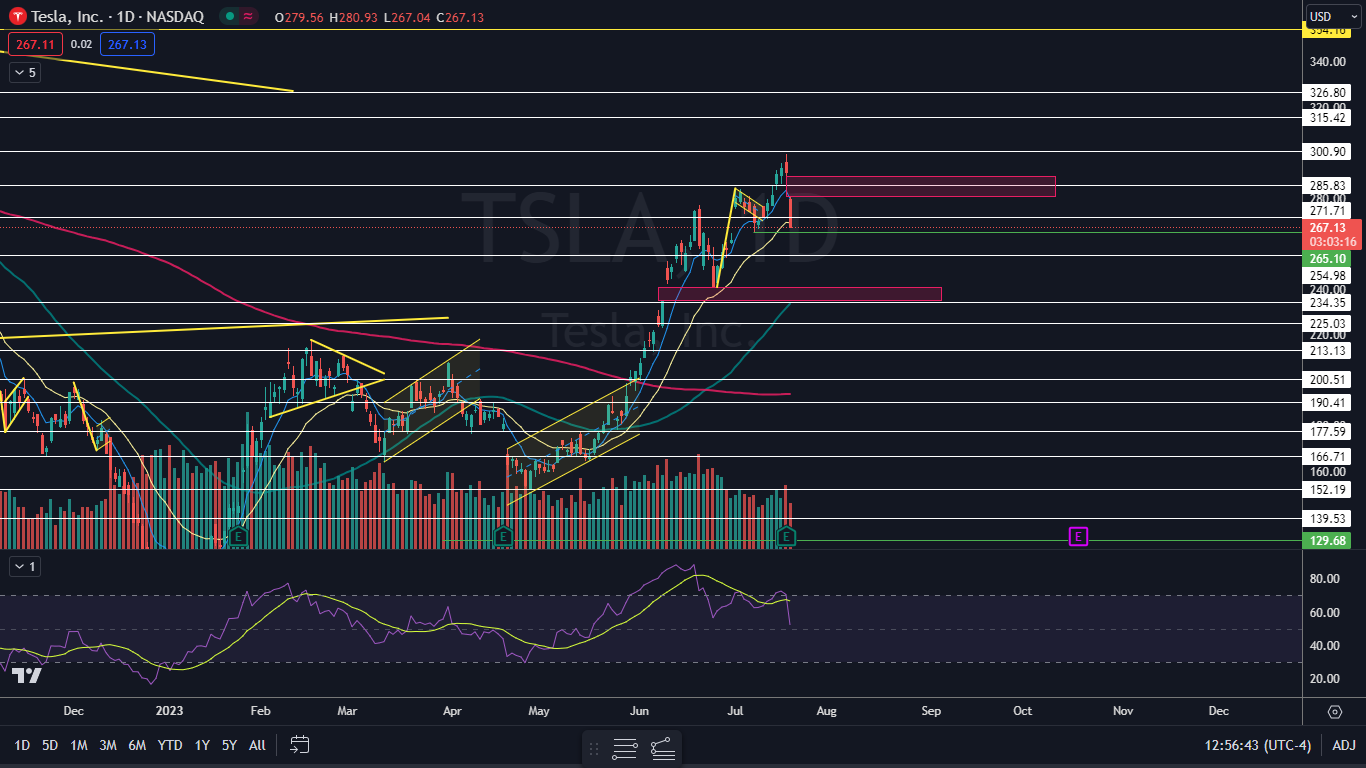
The Tesla Chart: Tesla was working to print a bearish kicker candlestick on Thursday, which suggests lower prices could come again on Friday. If Tesla continues to move lower on decreasing volume, the stock is likely to print a bullish reversal candlestick, such as a doji or hammer candlestick, over the next few days, which could signal a reversal to the upside.
- Tesla left a gap above between $280.93 and $289.52. Gaps on charts are about 90% likely to fill in the future and when Tesla rebounds to fill the gap, the stock may find at least temporary resistance at the top of the empty trading range.
- If Tesla finds support at $265.10 and bounces up from that area, the stock will form a triple bottom pattern, when paired with similar price action at that level on July 10 and July 11. If the stock falls under that area, Tesla’s uptrend will be negated and a downtrend could be in the works.
- Tesla has resistance above at $271.71 and $285.83 and support below at $265.10 and $254.98.
 Read Next: Jobless Claims Fall More Than Expected, But Investors Still Expect Fed Hike Next Week
Photo: Courtesy Tesla Inc.
© 2025 Benzinga.com. Benzinga does not provide investment advice. All rights reserved.
Trade confidently with insights and alerts from analyst ratings, free reports and breaking news that affects the stocks you care about.

