Zinger Key Points
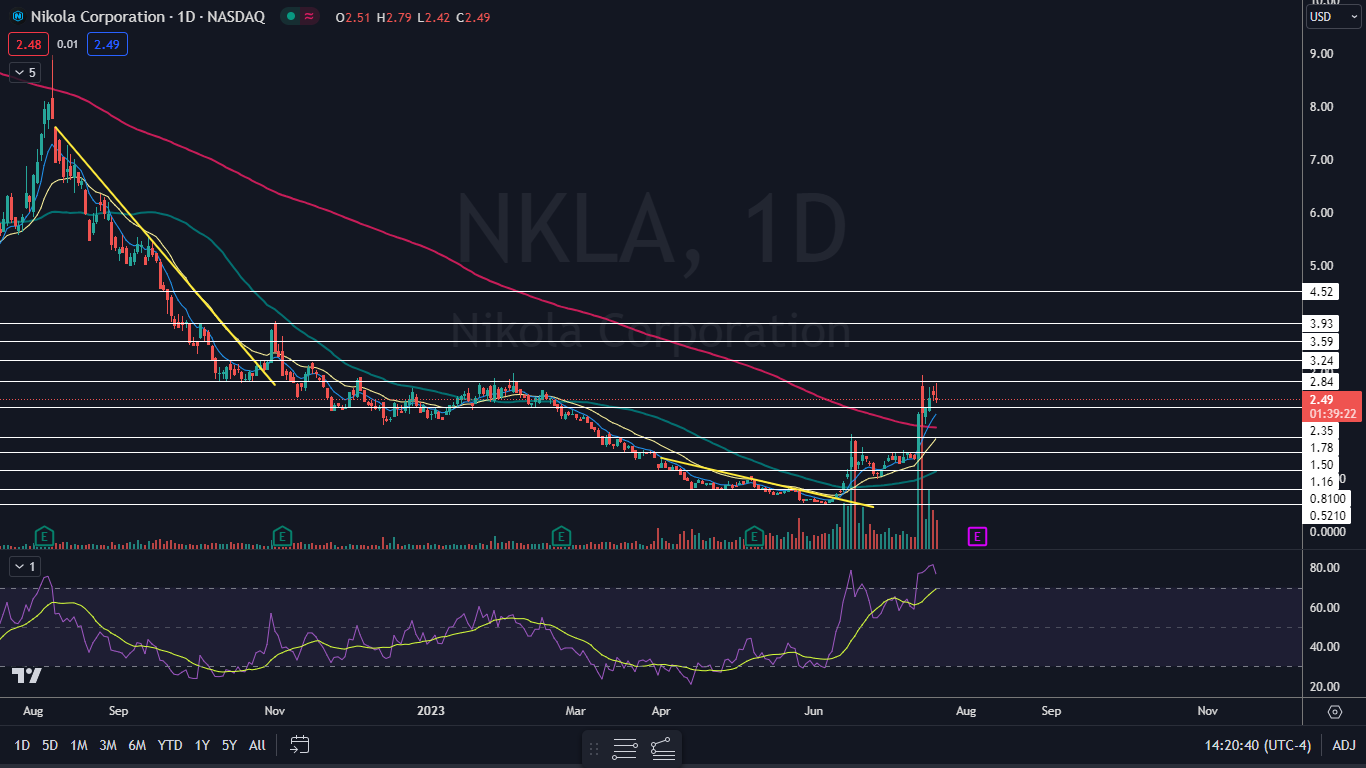
- Nikola has been consolidating a nearly 100% surge north by printing a series of inside bars.
- The sideways consolidation is helping to bring the stock's RSI slightly lower.
- China’s new tariffs just reignited the same market patterns that led to triple- and quadruple-digit wins for Matt Maley. Get the next trade alert free.
Nikola Corp NKLA was sliding more than 4% lower Thursday in continued consolidation after surging nearly 100% on July 13 and 14 after the company announced an agreement with BayoTech.
On Wednesday, the EV-maker announced Fortescue Future Industries will acquire Nikola's Phoenix Hydrogen Hub project, which caused the stock to pop slightly higher but with decreasing volume. Read more here...
The consolidation is helping to bring Nikola’s relative strength index (RSI) down from the 82% the indicator reached on Wednesday. Bullish traders would prefer to see the stock continue to trade sideways or slightly lower to further decrease the RSI.
RSI is an indicator technical traders use to measure bullish and bearish price momentum. RSI levels can range between 0 and 100, with levels between 30 and 70 generally considered to be healthy.
When a stock’s RSI falls below the 30% level, it's considered to be oversold. When a stock enters oversold territory, it indicates the securities price no longer reflects the asset's true value, which can signal a reversal to the upside is in the cards.
When a stock’s RSI rises above the 70% area, it is considered to be overbought. When a stock enters overbought territory, it signals the securities price is elevated to its intrinsic value, which can signal a reversal to the downside is on the horizon.
Want direct analysis? Find me in the BZ Pro lounge! Click here for a free trial.
The Nikola Chart: Nikola’s consolidation has so far taken place within five inside bars, all with price action occurring within the trading range on July 14. Traders can watch for the stock to eventually break up or down from the mother bar on higher-than-average volume to gauge future direction but the pattern leans bullish because Nikola has been trading higher recently.
- On July 13, Nikola regained the 200-day simple moving average (SMA) as support, which indicates the stock is trading in a new bull cycle. If Nikola can remain above the level, the 50-day SMA will cross above the 200-day, which will cause a golden cross to form.
- Over the last three trading days, Nikola has attempted to regain support near the $2.80 level but failed. Bullish traders want to see Nikola pop up above that area, while bearish traders want to see the stock close a trading session under $2.30, which could put the stock in jeopardy of retesting the 200-day SMA as support.
- Nikola has resistance above at $2.84 and at $3.24 and support below at $2.35 and at $1.78.
 Read Next: Trading Strategies For Tesla Stock Following Post-Q2 Earnings Sell-Off
Courtesy: Nikola
© 2025 Benzinga.com. Benzinga does not provide investment advice. All rights reserved.
Trade confidently with insights and alerts from analyst ratings, free reports and breaking news that affects the stocks you care about.