
Zinger Key Points
- Disney is trading in a possible bear flag pattern on the daily chart.
- The measured move on a breakdown from the bull flag is about 6%.
- Get Pro-Level Earnings Insights Before the Market Moves
Walt Disney Co DIS traded slightly lower Thursday, pressured downward by Netflix, which tumbled over 8% after printing mixed second-quarter earnings.
The entertainment conglomerate may be experiencing weakness in its streaming division amid the SAG-AFTRA union strike.
Disney is also facing legal issues, which include a dispute with Google in an Indian court and in Florida, where Governor Ron DeSantis continues fighting to remove Disney’s self-governing control over its theme park.
The recent downturn, paired with three days of sideways consolidation, may have settled Disney into a bear flag pattern.
The bear flag pattern is created with a steep drop lower forming the pole, which is then followed by a consolidation pattern that brings the stock higher between a channel with parallel lines or into a tightening triangle pattern.
For bullish traders, the "trend is your friend" (until it's not) and the stock may continue to rise upwards within the following channel for a short period of time. Aggressive traders may decide to purchase the stock at the lower trendline and exit the trade at the higher trendline.
Want direct analysis? Find me in the BZ Pro lounge! Click here for a free trial.
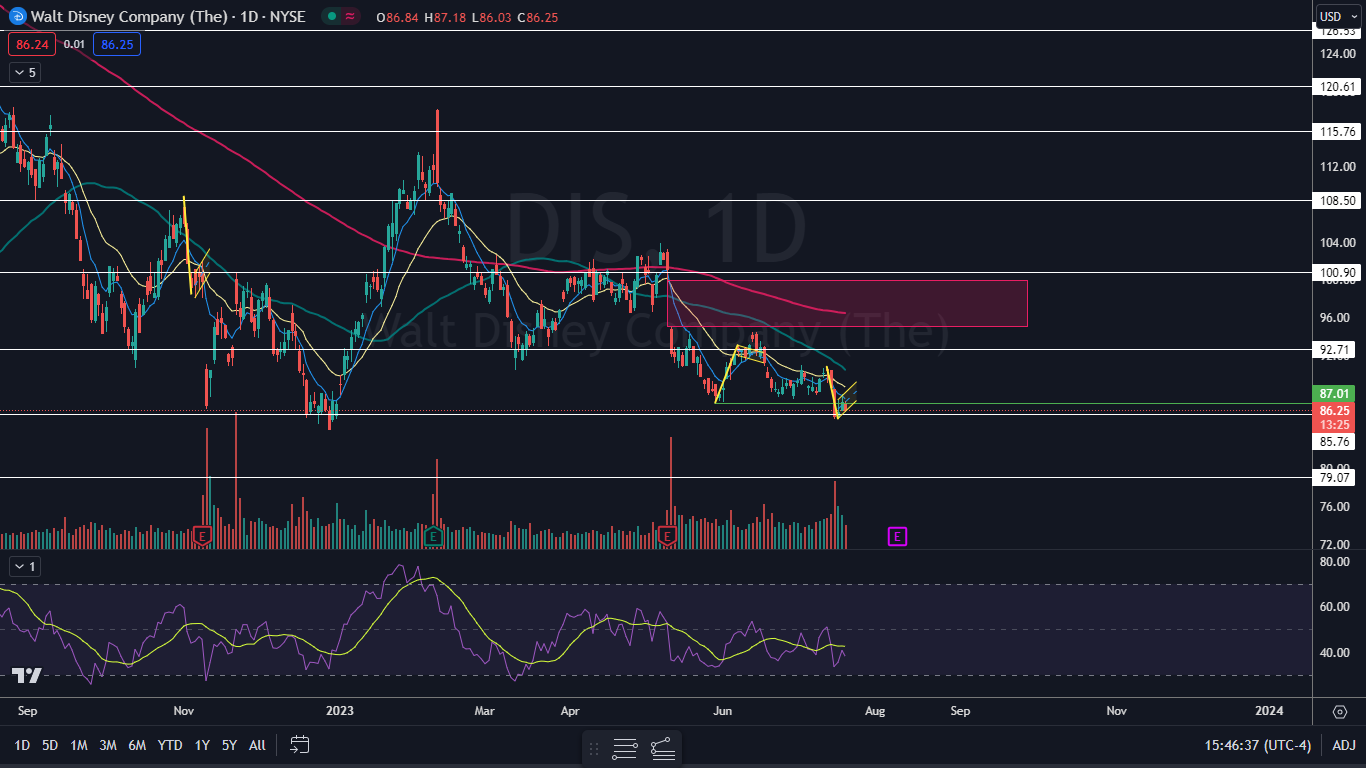
The Disney Chart: Disney’s possible bear flag pattern was printed between July 13 and Thursday, with the downward sloping pole formed during the first three trading days of that timeframe and the flag formed since. The measured move of the pattern is about 6%, which suggests the stock could drop toward the $82.50 mark on a breakdown from the flag.
- Bearish traders want to see big bearish volume come in and break the stock down from the flag formation, which could accelerate a move to the downside. Bullish traders want to see Disney regain the eight-day exponential moving average, which would negate the flag and set the stock into a new uptrend on the daily chart.
- Disney has resistance above at $92.71 and at $100.90 and support below at $85.76 and at $79.07.
Read Next: What's Going On With Disney Shares
© 2025 Benzinga.com. Benzinga does not provide investment advice. All rights reserved.
Trade confidently with insights and alerts from analyst ratings, free reports and breaking news that affects the stocks you care about.

