Zinger Key Points
- The VIX has been holding support near 13, bouncing up from the area on multiple occasions.
- The index hasn't traded at this level since February 2020.
- Feel unsure about the market’s next move? Copy trade alerts from Matt Maley—a Wall Street veteran who consistently finds profits in volatile markets. Claim your 7-day free trial now.
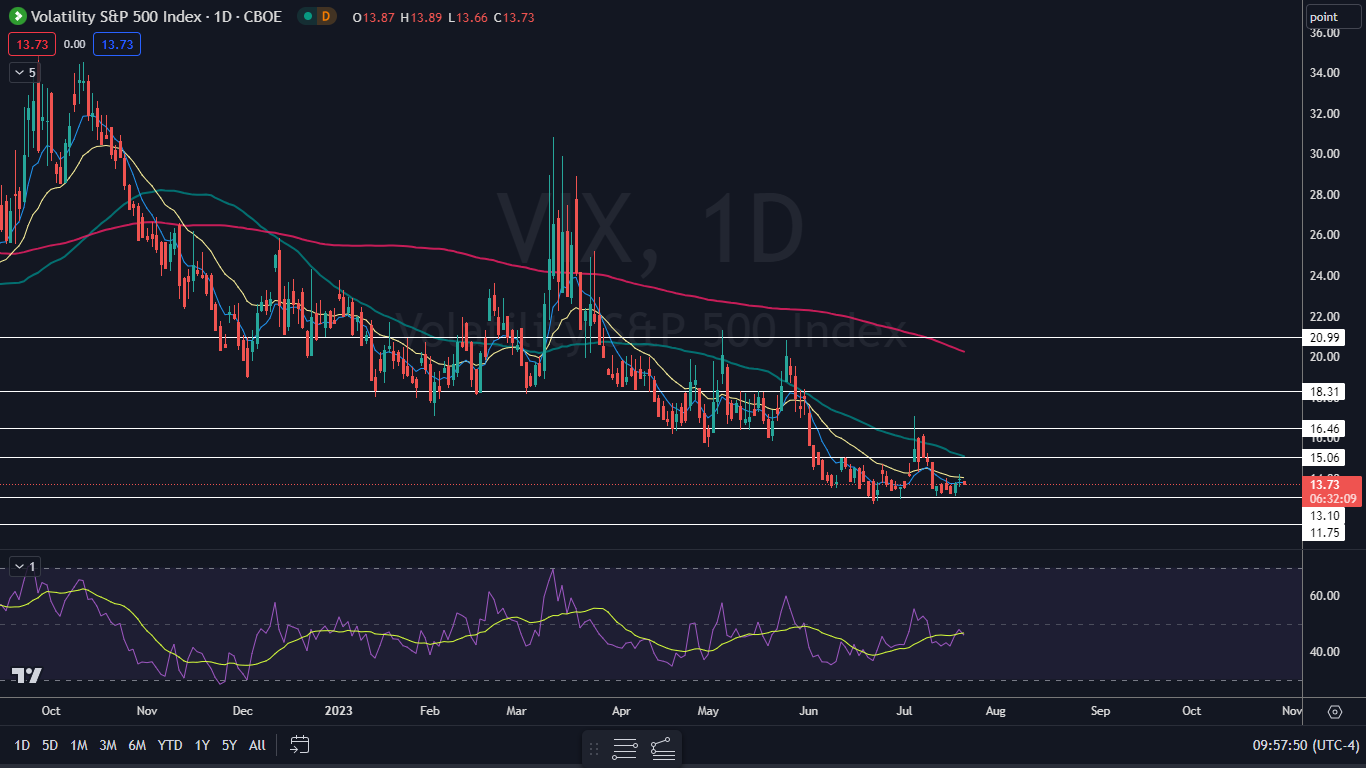
The CBOE Volatility Index VIX, tracked by the ProShares Ultra VIX Short Term Futures ETF UVXY and other tickers, was falling about 1.6% Friday after bouncing up off the $13 mark on Wednesday and Thursday to print a quintuple bottom pattern.
Traders and investors are looking ahead to July 25 and 26, when the Federal Reserve is scheduled to meet and decide whether to apply another rate hike after pausing its campaign in June.
The VIX is used to measure the expectation of near-term volatility in the stock market, and volatility is used to gauge market sentiment, specifically the level of fear that exists in the S&P 500.
The stock market appears to be attempting to price in a hawkish tone from the Fed and that, paired with big-tech earnings season, could cause volatility to increase
Traders wishing to trade the volatility in the stock market can use MIAX’s SPIKES Volatility products. The products, which are traded on SPIKES Volatility Index SPIKE, track expected volatility in the SPDR S&P 500 ETF Trust SPY over the next 30 days.
Want direct analysis? Find me in the BZ Pro lounge! Click here for a free trial.
The VIX Chart: The VIX hasn’t traded at the 13 level since February 2020, prior to the COVID-19 pandemic beginning in the U.S. The area has been holding as solid support and the index has bounced up from the area on five occasions since June 23.
- On Thursday, the VIX broke up briefly from its sideways pattern and printed a doji candlestick and a higher high, which suggested the index could retrace on Friday. On Friday, the VIX was falling lower, attempting to break down from an inside bar pattern.
- If the VIX falls under Thursday’s low-of-day, the index is likely to retest support near 13. If that happens, traders who are bearish on the stock market and bullish on volatility want to see the VIX hold support there.
- Traders who are bullish on the stock market want to see the VIX break down under 13, which could set the index into another downtrend.
- The VIX has resistance above at 15.06 and at 16.46 and support below at 13.10 and at 11.75.
 Read Next: AI, Big Tech And Blue Chips: These 3 Charts Signal Shift In The Market
Photo: Shutterstock
Edge Rankings
Price Trend
© 2025 Benzinga.com. Benzinga does not provide investment advice. All rights reserved.
Trade confidently with insights and alerts from analyst ratings, free reports and breaking news that affects the stocks you care about.