Zinger Key Points
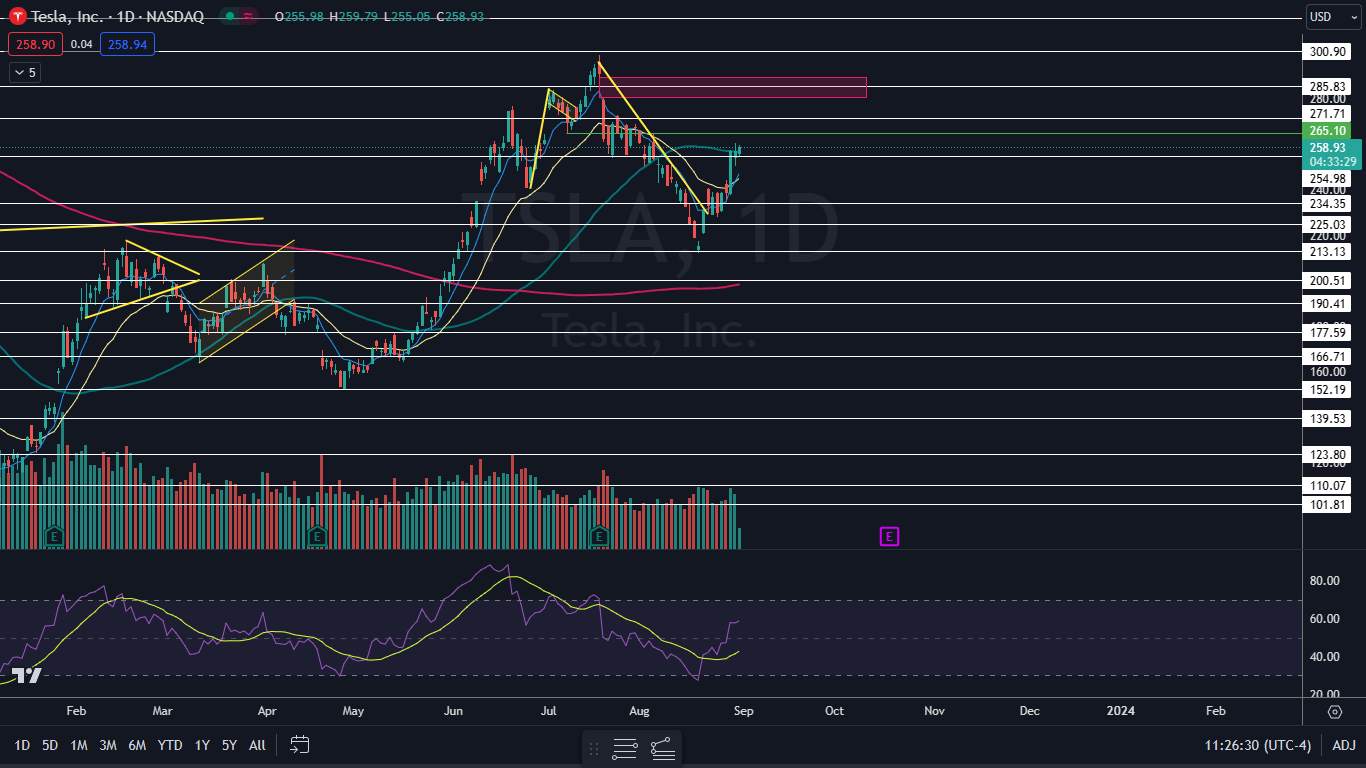
- Tesla is trading in an uptrend an on Thursday, the stock was forming an inside bar above the 50-day SMA.
- Tark is an ETF that tracks Cathie Wood-led ARKK and aims to offer a 200% return.
- Get real-time earnings alerts before the market moves and access expert analysis that uncovers hidden opportunities in the post-earnings chaos.
Tesla, Inc TSLA was popping up slightly higher Thursday, in tandem with many other big tech stocks after U.S. Personal Consumption Expenditures data came in softer-than-expected.
The market is currently pricing in just a 9.5% chance that the Federal Reserve will hike rates in September, during a data-heavy week that has shown the Fed’s monetary tightening is working to slow the economy and bring down inflation.
While the economy has been slowing, Tesla has been growing its market share, propelled by price cuts that initially worried investors. The EV giant grew its global market share from 16% in the second quarter of 2022 to 20% in the second quarter of this year. Read More Here...
On Thursday, Tesla was trading in an inside bar pattern, but the stock has seen a major upswing recently, rising over 21% since its Aug. 18 low of $212.36. The move higher has caused ETFs that hold the company to also see increased prices, such as Cathie Wood’s Ark Innovation ETF ARKK, which Benzinga pointed out on Tuesday.
For traders looking to maximize the potential gains in ARKK, AXS 2x Innovation ETF TARK offers 2X leverage, allowing sophisticated traders to see daily gains of 200% of the daily performance of Wood’s ETF. This leverage boosts trade performance, which can offer significant gains for traders.
ARKK’s largest holdings are Tesla, weighted at 10.75%, Roku, Inc ROKU, weighted at 8.35% and Zoom Video Communications-A, which makes up 7.65% of the fund’s holdings.
It should be noted that leveraged funds are designed for short-term traders and shouldn’t be held for a long period of time.
Want direct analysis? Find me in the BZ Pro lounge! Click here for a free trial.
The Tesla Chart: Tesla has been trading mostly sideways since Tuesday, when the stock surged almost 8% higher to reach the 50-day simple moving average (SMA). On Wednesday, Tesla regained the 50-day SMA as support and on Thursday, the stock appeared to be consolidating above that area, forming an inside bar.
- Tesla’s inside bar leans bullish for continuation because the stock was trading higher before forming it and has regained the 50-day. Traders and investors can watch for Tesla to break up or down from Wednesday’s mother bar on higher-than-average volume to gauge whether another bull run is on the horizon or a retracement is in the cards.
- Tesla is trading in a confirmed uptrend, making a series of higher highs and higher lows. If the uptrend continues, a gap that exists between $280.93 and $289.52 is likely to fill. If big bearish volume comes in and drops Tesla back under the 50-day SMA, bullish traders want to see the stock hold support at the eight-day exponential moving average.
- Tesla has resistance above at $265.10 and at $271.71 and support below at $254.98 and at $234.35.
Image sourced from Shutterstock
© 2025 Benzinga.com. Benzinga does not provide investment advice. All rights reserved.
Trade confidently with insights and alerts from analyst ratings, free reports and breaking news that affects the stocks you care about.
 Read Next: