


Zinger Key Points
- Nvidia is working to form a double inside bar pattern, which leans bearish for continuation.
- The stock is also trading in a downtrend, with a significant gap down to the $306 mark.
- Feel unsure about the market’s next move? Copy trade alerts from Matt Maley—a Wall Street veteran who consistently finds profits in volatile markets. Claim your 7-day free trial now.
Nvidia Corporation NVDA was trading slightly lower on Wednesday in tandem with the general market amid reports indicating that Microsoft Corp MSFT is scaling down its orders for Nvidia's H100 AI Chips.
The chipmaker was trading on lower-than-average volume, indicating an ongoing period of consolidation, which has also settled the stock into a double inside bar pattern on the daily chart.
An inside bar pattern indicates a period of consolidation and is usually followed by a continuation move in the direction of the current trend.
An inside bar pattern has more validity on larger time frames (four-hour chart or larger). The pattern has a minimum of two candlesticks and consists of a mother bar (the first candlestick in the pattern) followed by one or more subsequent candles. The subsequent candle(s) must be completely inside the range of the mother bar, and each is called an "inside bar."
A double, or triple inside bar can be more powerful than a single inside bar. After the break of an inside bar pattern, traders want to watch for high volume for confirmation the pattern was recognized.
Want direct analysis? Find me in the BZ Pro lounge! Click here for a free trial.
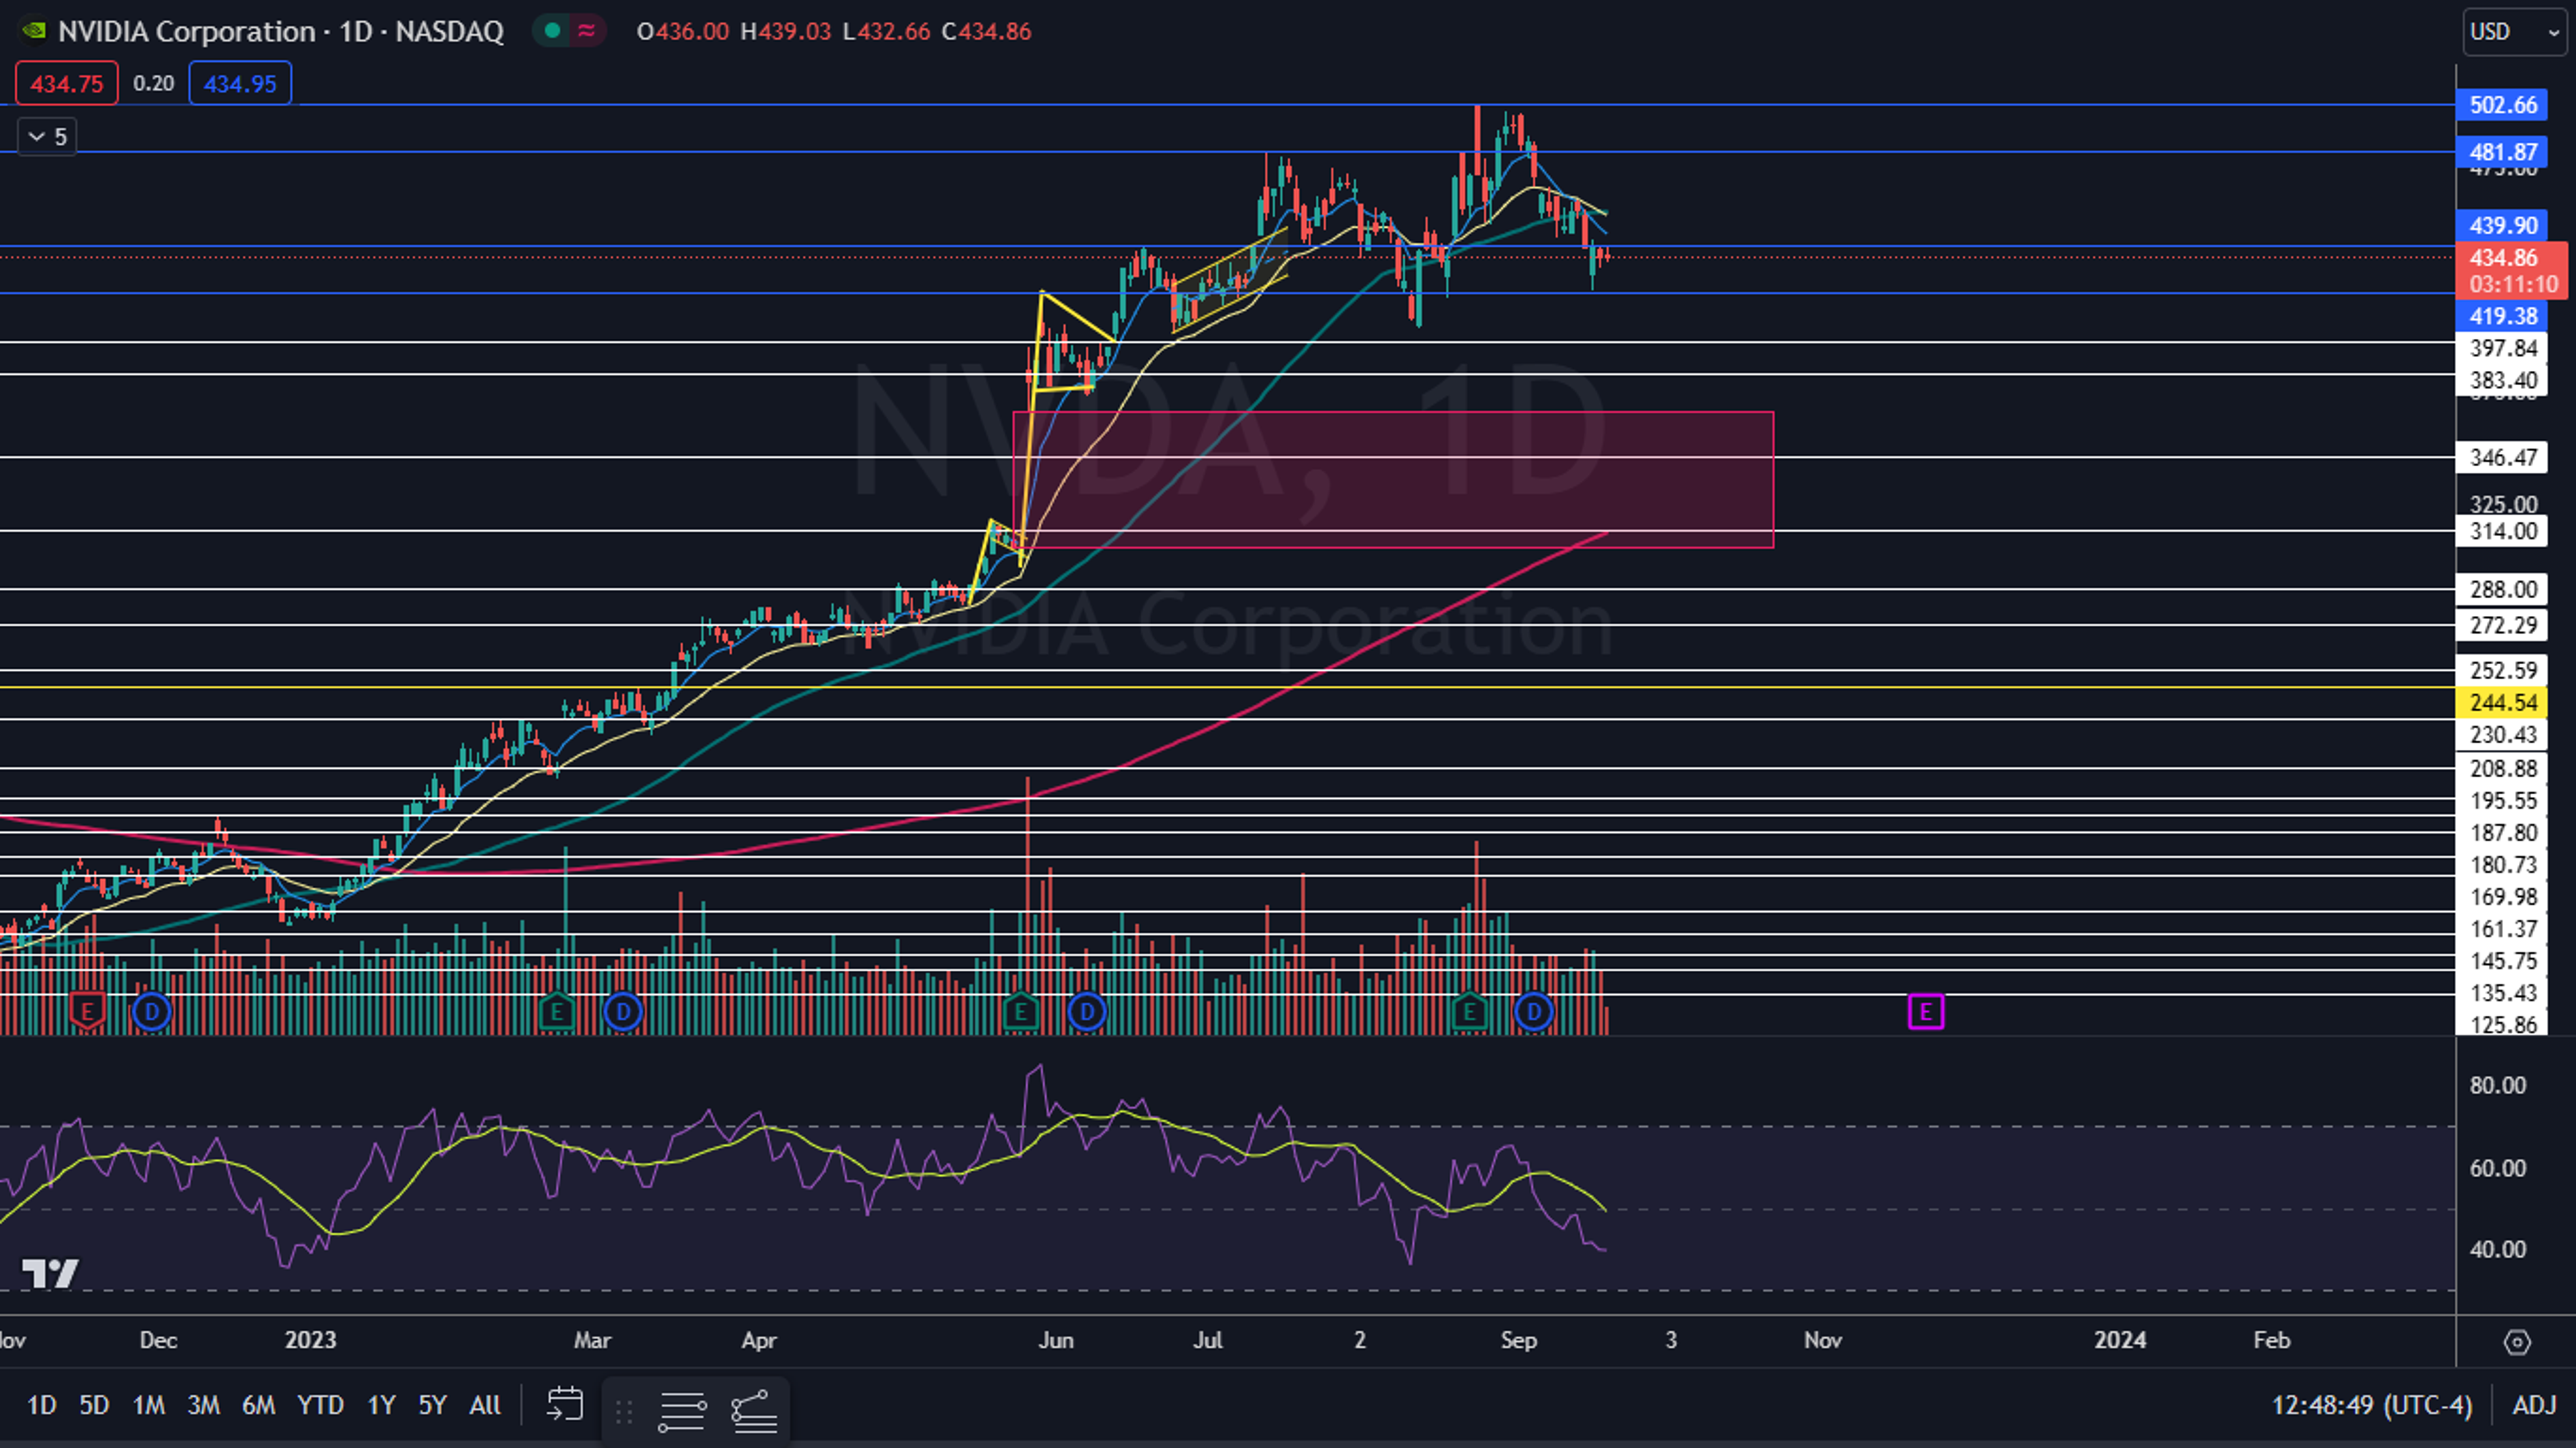
The Nvidia Chart: Nvidia’s double inside bar pattern leans bearish because the stock was trading lower before forming it. Nvidia is also trading in a downtrend, making a series of lower highs and lower lows, with the most recent lower high formed on Sept. 14 at $459.87 and the most recent lower low printed at the $420 mark on Monday.
- Bearish traders want to see the stock break down from Monday’s mother bar on high-than-average volume, which could accelerate downside pressure. Bullish traders want to see the stock break up above the eight-day exponential moving average, which could indicate a rebound to the upside is on the horizon.
- Nvidia has a gap below between $306.07 and $366.35, which could come into play if the stock continues to fall. Gaps on charts fill about 90% of the time and if Nvidia falls to the lower range of the gap, it could find support there at least for a period of time.
- Nvidia has resistance above at $439.90 and at $481.87 and support below at $419.38 and at $397.84.

Edge Rankings
Price Trend
© 2025 Benzinga.com. Benzinga does not provide investment advice. All rights reserved.
Trade confidently with insights and alerts from analyst ratings, free reports and breaking news that affects the stocks you care about.

