Zinger Key Points
- NUGT is a double-leveraged fund that tracks stocks in the gold mining sector.
- The ETF is trading in both an uptrend and a rising channel pattern.
- In a market dominated by tariff tensions, geopolitical surprises, and Fed uncertainty, Matt Maley's technical approach delivers clear entry & exit points for consistent income potential. Try it free for 7 days
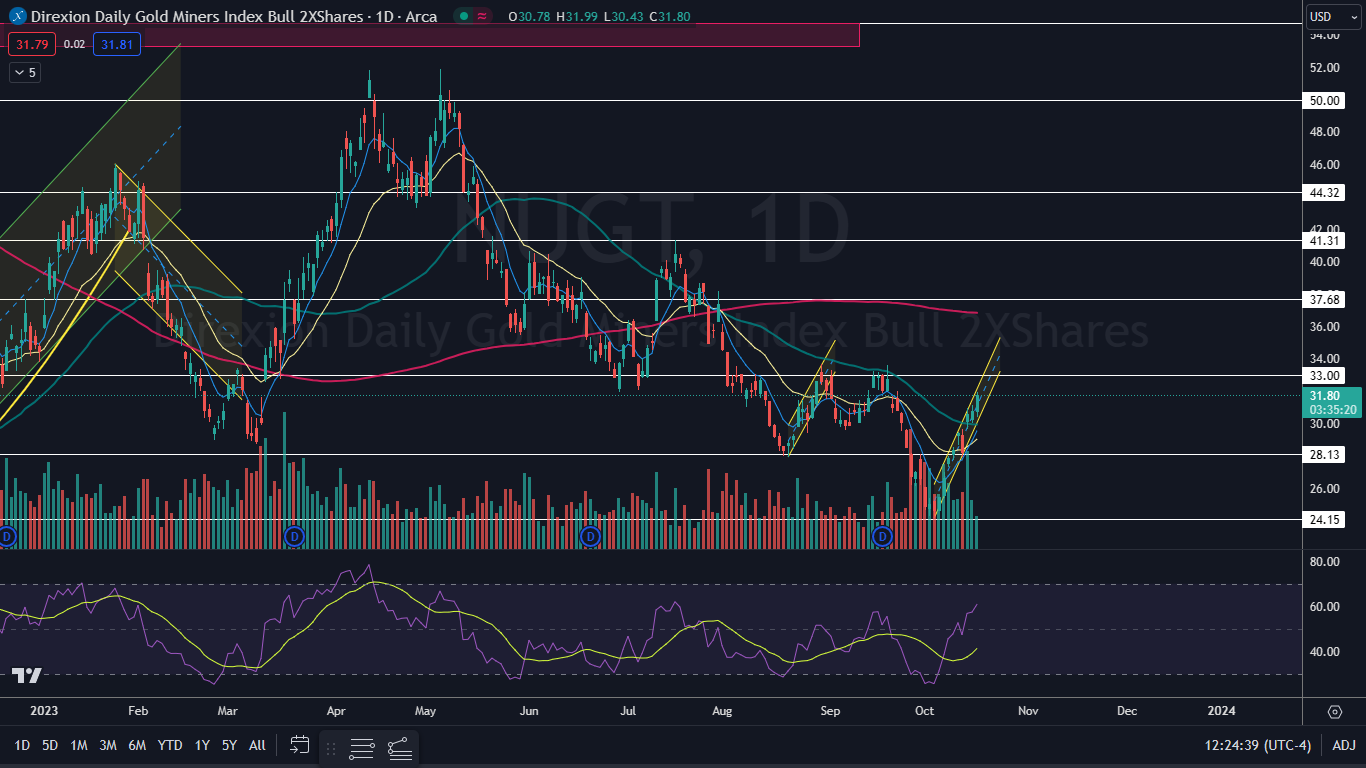
Direxion Daily Gold Miners Index Bull 2X Shares NUGT was spiking about 3.5% higher on Tuesday, continuing to fly north within a rising channel pattern on the daily chart.
Spot gold was rising higher Tuesday, trading in tandem with the S&P 500, which opened lower after U.S. retail sales data came in stronger-than-expected but was shooting higher intraday. Read more here...
Want direct analysis? Find me in the BZ Pro lounge! Click here for a free trial.
NUGT, which usually follows the price of spot gold was rising more significantly, likely for technical analysis reasons, because the ETF has been trading in a strong uptrend since Oct. 4.
NUGT is a double-leveraged fund that is designed to outperform the NYSE Arca Gold Miners Index by 200%. The ETF tracks several gold and silver mining companies, with Newmont Corp NEM, Barrick Gold Corp GOLD and Franco-Nevada Corp FNV making up 31.56% of its holdings.
It should be noted that leveraged ETFs are meant to be used as a trading vehicle by experienced traders, as opposed to a long-term investment. Leveraged ETFs should never be used by an investor with a buy-and-hold strategy or those who have low-risk appetites.
For traders wanting to play the gold mining index bearishly, Direxion offers Direxion Daily Gold Miners Index Bear 2X Shares DUST.
The NUGT Chart: Since reversing into an uptrend on Oct. 4 from the $24.19 mark, NUGT has formed a series of higher highs and higher lows. The most recent higher low was created on Oct. 12 at $27.94 and the most recent confirmed higher high was printed at the $29.50 mark the trading day prior.
Since Oct. 12, NUGT has continued to rise, regaining the 50-day simple moving average on Oct. 13 and continuing to spike higher on Monday and Tuesday. Eventually, NUGT is likely to form a bearish reversal candlestick, such as a doji or shooting star candlestick, which could signal the local top has occurred and a pullback is on the horizon.
The rising channel NUGT is trading in is bullish for the short term but can be bearish down the road. If the ETF drops through the lower ascending trend line of the channel on higher-than-average volume, a longer-term downtrend could be in the cards.
NUGT has resistance above at $33 and at $37.68 and support below at $28.13 and at $24.15.
Edge Rankings
Price Trend
© 2025 Benzinga.com. Benzinga does not provide investment advice. All rights reserved.
Trade confidently with insights and alerts from analyst ratings, free reports and breaking news that affects the stocks you care about.
 Read Next: