Zinger Key Points
- TARK is an actively managed double-leveraged ETF aiming to return 200% of the daily performance of ARKK.
- The ETF is trading in a falling channel pattern, possibly forming a lower low, which suggests a bounce is in the cards.
- China’s new tariffs just reignited the same market patterns that led to triple- and quadruple-digit wins for Matt Maley. Get the next trade alert free.
The AXS 2x Innovation ETF TARK was slightly volatile on Monday, in tandem with the Cathie Wood-led ARK Innovation ETF ARKK, which TARK tracks.
TARK is an actively managed double-leveraged ETF aiming to return 200% of the daily performance of ARKK.
Why ARKK Has Been Seeing Downside Pressure: Despite Coinbase Global, Inc, which is the second largest holding in the ARKK fund, seeing some slightly bullish price action ahead of its third-quarter earnings on Thursday, the ETF was stalling due to Tesla’s price action.
Tesla holds the highest weighting within ARKK and has continued to fall lower since reporting a third-quarter earnings miss on Oct. 18.
A larger bounce may be imminent for ARKK, however, because the ETF was bouncing up from the bottom of a falling channel pattern and when the fund rebounds, TARK will offer 2X the gains of ARKK.
A falling channel pattern is bearish for the short term but can be bullish down the road.
For bearish traders, the "trend is your friend" (until it's not) and the stock is likely to continue downwards. Aggressive traders may decide to short the stock at the upper trendline and exit the trade at the lower trendline.
Bullish traders will want to watch for a break up from the upper descending trendline, on high volume, for an entry. When a stock breaks up from a descending channel, it's a powerful reversal signal and indicates a rally is likely in the cards.
Want direct analysis? Find me in the BZ Pro lounge! Click here for a free trial.
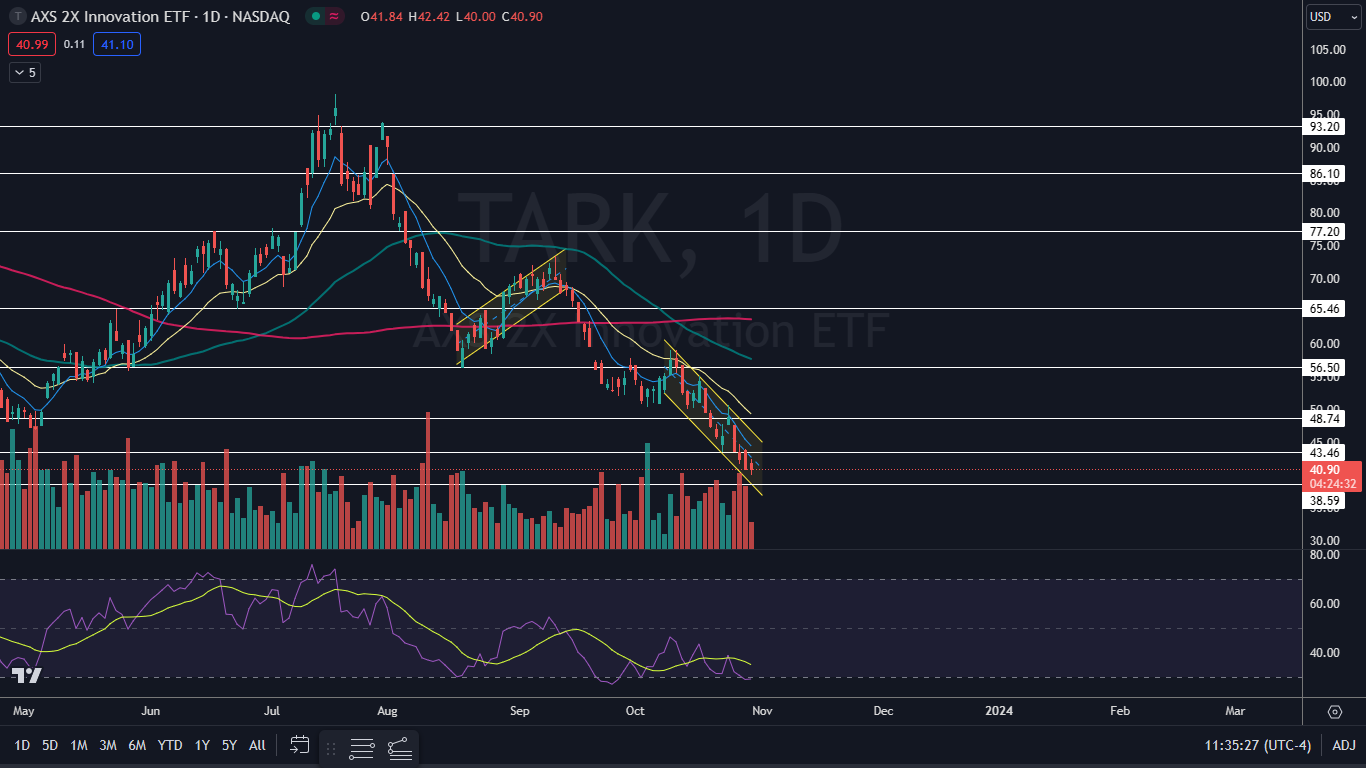
The TARK Chart: Tark started to trade in a falling channel pattern on Oct. 10 and within the formation, the ETF has been making a consistent series of lower highs and lower lows. The most recent lower high was formed on Oct. 24 at $50.61 and the most recent confirmed lower low was printed at the $43.46 mark the day prior.
- On Monday, TARK fell near the bottom descending trend line of the channel and was attempting to bounce up from that area. If the ETF closes the trading session with a lower wick, TARK will print a doji or hammer candlestick, which could indicate the next lower low has occurred and a bounce is on the horizon.
- If TARK can eventually rebound up to the upper trend line of the channel and possibly break above that area on higher-than-average volume, it could signal a longer-term reversal is on the horizon. If that happens, the ETF will also regain the eight-day exponential moving average, which would give bullish traders more confidence in the future.
- TARK has resistance above at $43.46 and at $48.74 and support below at $38.59 and at the psychologically important $35 mark.
Edge Rankings
Price Trend
© 2025 Benzinga.com. Benzinga does not provide investment advice. All rights reserved.
Trade confidently with insights and alerts from analyst ratings, free reports and breaking news that affects the stocks you care about.
 Read Next: