Zinger Key Points
- Analysts estimate that Apple will print earnings per share of $1.31 on revenues of $84.18 billion.
- The stock is trading in a confirmed uptrend above the 200-day SMA.
- China’s new tariffs just reignited the same market patterns that led to triple- and quadruple-digit wins for Matt Maley. Get the next trade alert free.
Apple Inc AAPL is set to print fourth-quarter financial results after the market closes Thursday. The stock was trading almost 2% higher heading into the event.
When the tech giant printed its third-quarter results on Aug. 3, the stock dropped 4.56% the following day and continued in its downtrend, which eventually led Apple to reach a low of $165.67 on Oct.26.
For that quarter, Apple reported EPS of $1.26 on revenue of $81.8 billion. The company came in ahead of estimates for EPS of $1.19 on revenues of $81.7 billion.
For the fourth quarter, analysts estimate that Apple will print earnings per share of $1.31 on revenues of $84.18 billion.
Ahead of the event, Wedbush analyst Daniel Ives reiterated an Outperform rating on the stock and maintained a price target from $240. The price target suggests a whopping 38% upside for the iPhone maker. Read More Here…
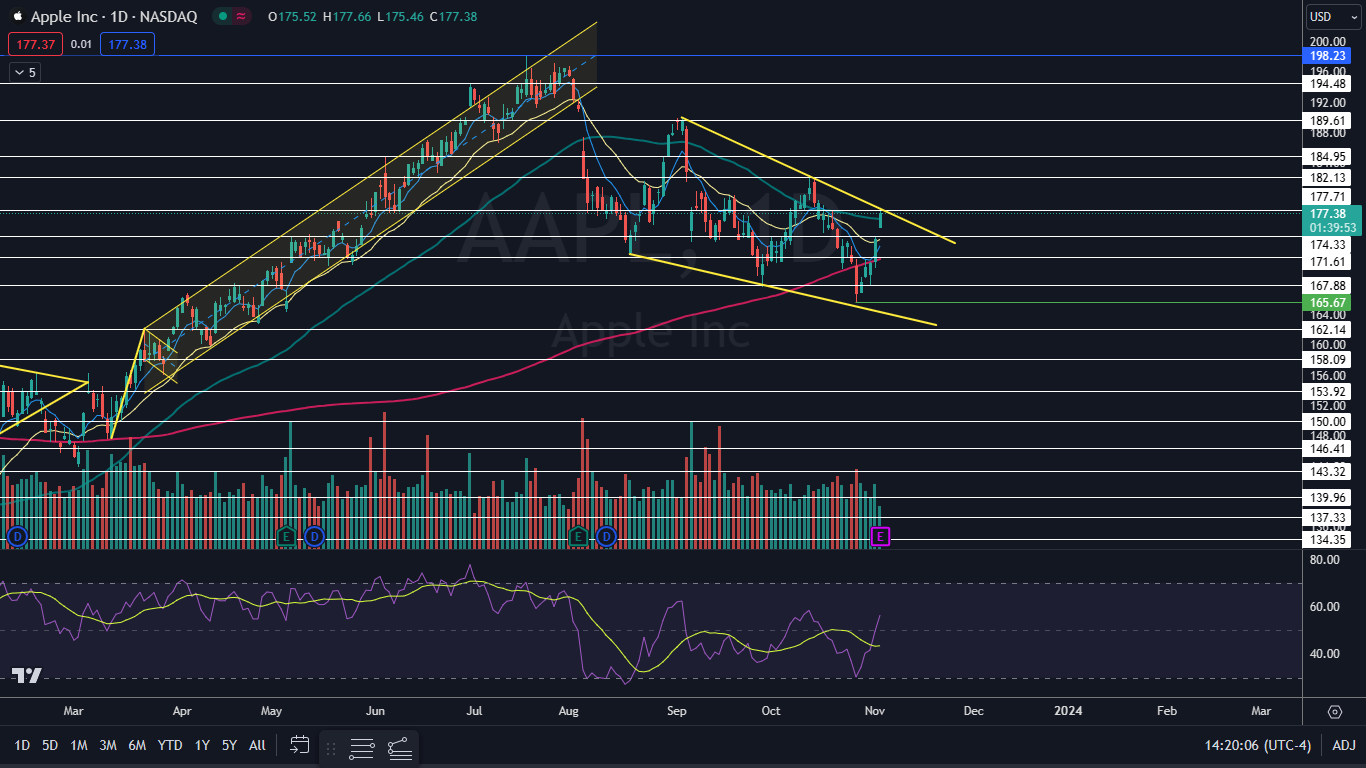
From a technical analysis perspective, Apple's stock looks bullish heading into the event, trading in a confirmed uptrend and recently regaining the 200-day simple moving average (SMA) as support.
It should be noted that holding stocks or options over an earnings print is akin to gambling because stocks can react bullishly to an earnings miss and bearishly to an earnings beat.
Options traders, particularly those who are holding close-dated calls or puts, take on the extra risk because the institutions writing the options increase premiums to account for implied volatility.
Traders wanting to play the potential upside in Apple may choose to take a position in Direxion Daily Apple Bull 1.5X Shares AAPU, which seeks to return 150% of the performance of Apple’s stock.
Conversely, traders who are bearish on Apple could play Direxion Daily Apple Bear 1X Shares AAPD, which tracks Apple to the inverse.
Want direct analysis? Find me in the BZ Pro lounge! Click here for a free trial.
The Apple Chart: Apple negated its downtrend on Oct. 31 and on Thursday, the stock formed a higher high to confirm a new uptrend. On Wednesday, Apple regained the 200-day SMA, indicating the price action under that area between Oct. 26 and Tuesday was a bear trap.
- On Thursday, Apple was attempting to regain the 50-day SMA as support. If Apple receives a positive reaction to its earnings print and closes Friday’s session above that area, the stock will also break up from a falling wedge pattern, which could signal a longer-term rebound.
- If Apple suffers a bearish reaction to its earnings and falls back under the 200-day SMA, the most recent price action will serve as a bull trap and selling pressure is likely to accelerate. Thursday’s push higher was taking place on lower-than-average volume, which likely has given bullish traders pause.
- Apple has resistance above at $177.71 and at $182.13 and support below at $174.33 and at $171.61.
Edge Rankings
Price Trend
© 2025 Benzinga.com. Benzinga does not provide investment advice. All rights reserved.
Trade confidently with insights and alerts from analyst ratings, free reports and breaking news that affects the stocks you care about.
 Read Next: