Zinger Key Points
- Roblox beat Q3 earnings estimates on both the top and bottom line.
- The stock broke up from a bull flag pattern and regained the 200-day SMA as support.
- Pelosi’s latest AI pick skyrocketed 169% in just one month. Click here to discover the next stock our government trade tracker is spotlighting—before it takes off.
Roblox Corporation RBLX was surging more than 17% on Wednesday, receiving a bullish reaction to its third-quarter financials after beating expectations.
For the quarter, Roblox printed an earnings loss of 45 cents per share on FY23 bookings growth of $839.453 million, coming in ahead of the estimate for a loss of 51 cents per share on booking growth of $829.49 million.
The gaming giant showed a high level of growth in daily active users, up 20% year-over-year to 70.2 million.
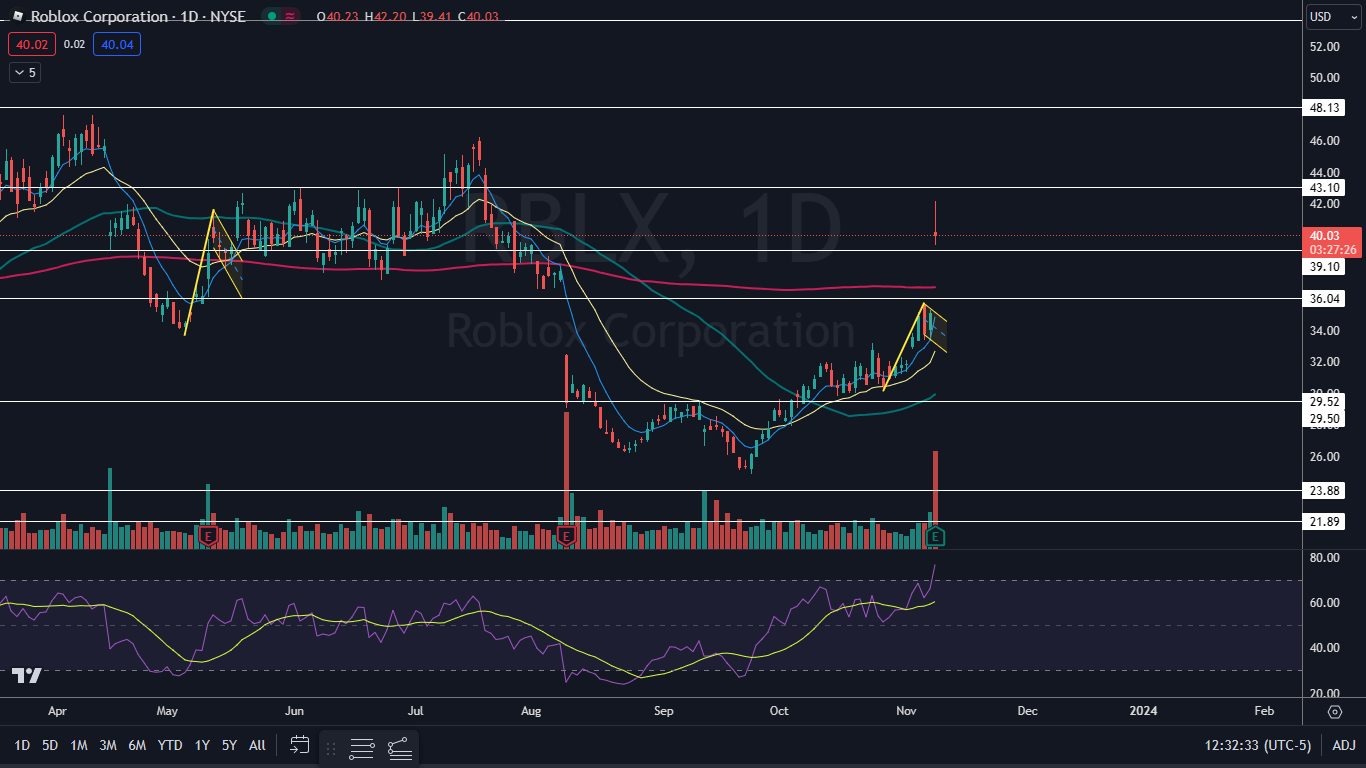
The positive reaction to Roblox print may have been anticipated by technical traders, because the stock had developed a bull flag pattern on the daily chart under the 200-day simple moving average.
Bullish traders and investors looking to play the possible continued upside in Roblox stock but with a diversified approach may choose to take a position in the AXS 2X Innovation ETF TARK. TARK is an actively managed double-leveraged ETF aiming to return 200% of the daily performance of Cathie Wood-led ARK Innovation ETF ARKK. Roblox is a top ten holding within ARKK, with a 4.24% weighting.
While ARKK and TARK were both trading lower on Wednesday, it should be noted that the two ETFs are forming possible bull flag patterns, with ARKK’s formation being created under the 200-day SMA.
Want direct analysis? Find me in the BZ Pro lounge! Click here for a free trial.
The Roblox Chart: Roblox’s bull flag was formed between Oct. 26 and Tuesday, with the upward-sloping pole created over the first eight days of that timeframe and the flag formed over Monday and Tuesday. The measured move of the flag is about 18%, suggesting Roblox completed the full implied move and is now likely to retrace.
- The stock is also trading in a confirmed uptrend, with the most recent higher low formed on Nov. 6 at $30.17 and the most recent confirmed higher high printed at the $34.35 mark on Oct. 24. If Roblox retraces on Thursday and holds above the 200-day SMA, another higher low will print, which could give bullish traders who aren’t already in a position a solid entry point.
- Bearish traders want to see big bearish volume come in and drop Roblox down under the 200-day SMA, which could accelerate downside pressure and potentially indicate Wednesday’s surge higher is a bull trap.
- Roblox has resistance above at $43.10 and at $48.13 and support below at $39.10 and at $36.04.
 Read Next: Roblox, Under Armour, GoPro, Nuvei And Other Big Stocks Moving Higher On Wednesday
Edge Rankings
Price Trend
© 2025 Benzinga.com. Benzinga does not provide investment advice. All rights reserved.
Trade confidently with insights and alerts from analyst ratings, free reports and breaking news that affects the stocks you care about.