Zinger Key Points
- DRIP is an inverse double-leveraged fund that tracks the oil and gas sector to the downside.
- The ETF broke up from a bull flag on Tuesday and crossed above the 200-day SMA.
- Feel unsure about the market’s next move? Copy trade alerts from Matt Maley—a Wall Street veteran who consistently finds profits in volatile markets. Claim your 7-day free trial now.
Direxion Daily S&P Oil & Gas Exp & Prod Bear 2X Shares DRIP was rising about 4.5% Tuesday after data released by the Bureau of Labor Statistics showed the Consumer Price Index (CPI) eased to an annual rate of 3.1% in November, which matched expectations.
Last week, OPEC+ nations agreed on new oil cuts amid oil production in the U.S. reaching record levels and supply outpacing demand. Despite the news, the United States Oil Fund USO fell to a five-month low the following day on Dec. 7, throwing the sector into a bear market.
Must Read: Crude Conundrum: US Oil Production Hits Record Levels, But Energy Stocks Aren't Pumping
Trending: Tesla Spinning Its Wheels: Snow-Challenged Cybertruck Gets Rescued By Rival Pickup
Analysts have recently turned bearish on the sector, with Morgan Stanley analyst Devin McDermott downgrading Marathon Oil Corporation Corp MRO from Overweight to Equal Weight on Monday and dropping a price target from $27 to $25. On Friday, JP Morgan analyst John Royall maintained an Overweight rating on Exxon Mobil Corp XOM and lowered a price target from $134 to $127.
DRIP is an inverse double-leveraged fund designed to track companies held in the S&P Oil & Gas Exploration & Production Select Industry Index by 200%. Inverse ETFs offer a vehicle for traders to play a group of stocks bearishly, without having to open a short position.
A few of the most popular companies held in the ETF are Exxon, which is weighted at 2.54% within the ETF; Occidental Petroleum Corporation OXY, weighted at 1.53%; and Marathon Oil, weighted at 1.54%.
It should be noted that leveraged ETFs are meant to be used as a trading vehicle as opposed to long-term investments.
For traders looking to play the oil and gas sector bullishly, Direxion offers the Direxion Daily S&P Oil & Gas Exp & Prod Bull 2X Shares GUSH.
Want direct analysis? Find me in the BZ Pro lounge! Click here for a free trial.
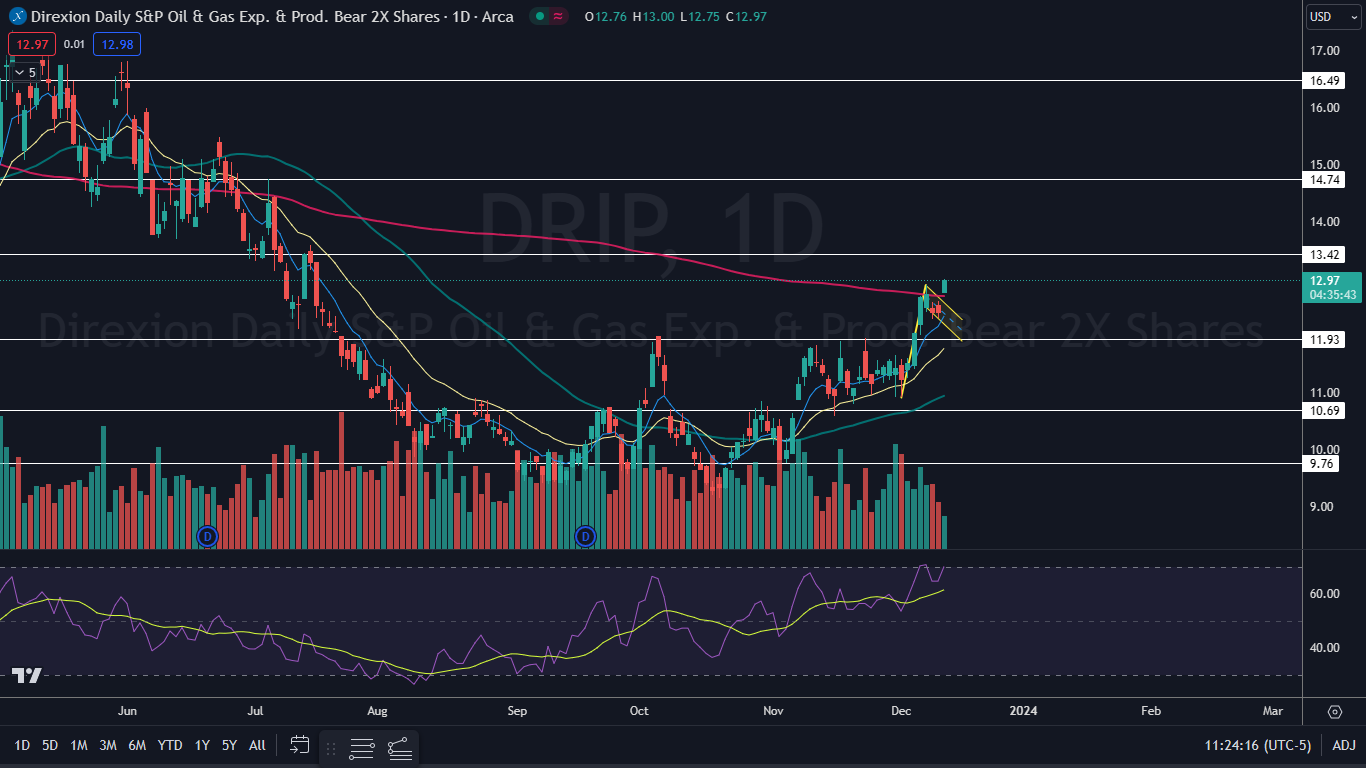
The DRIP Chart: DRIP broke up from a bull flag on Tuesday and crossed above the 200-day simple moving average (SMA), which threw the bearish ETF into a bull cycle. The bull flag was formed between Dec. 1 and Monday and has a measured move of about 18%, which suggests the ETF could rally toward the $14.50 mark.
- DRIP also confirmed a new uptrend on Monday and Tuesday, by printing both a higher low and a higher high. If the ETF falls over the next few trading days, bullish traders want to see DRIP bounce up from $12.30 mark, which would allow the uptrend to remain intact.
- Bullish traders want to see continued momentum push DRIP higher and for the ETF to remain above the 200-day SMA. If that happens, the 50-day SMA will eventually cross above the 200-day, which would cause a golden cross to form.
- Bearish traders want to see big bearish volume come in and drop DRIP back down under the 200-day, which could cause the ETF to form a lower low to negate the uptrend. If that happens and DRIP also falls below the eight-day exponential moving average, downside pressure could accelerate.
- DRIP has resistance above at $13.42 and at $14.74 and support below at $11.93 and at $10.69.

Edge Rankings
Price Trend
© 2025 Benzinga.com. Benzinga does not provide investment advice. All rights reserved.
Trade confidently with insights and alerts from analyst ratings, free reports and breaking news that affects the stocks you care about.