Zinger Key Points
- Analysts expect Netflix to report earnings per share of $2.22 on revenues of $8.719 billion.
- The stock recently filled an upper gap and fell slightly lower but is trading in a confirmed uptrend.
- Feel unsure about the market’s next move? Copy trade alerts from Matt Maley—a Wall Street veteran who consistently finds profits in volatile markets. Claim your 7-day free trial now.
Netflix, Inc NFLX will kick off big tech earnings on Tuesday when it prints its fourth-quarter financial results after the market close.
The stock was trading near flat heading into the event, in tandem with the S&P 500, which was consolidating mostly sideways after reaching a new all-time high of 4,868.41 on Monday.
After the streaming giant printed its third-quarter results on Oct. 18, the stock surged over 16% the following day and subsequently entered a steep uptrend on larger time frames, which brought Netflix to a high of $503.41 on Jan. 11.
For the third quarter, Netflix reported earnings per share of $3.73, beating the Street estimate of $3.49. The company reported revenues of $8.54 billion, which beat the $8.53-billion consensus estimate.
For the fourth quarter, analysts expect Netflix to report earnings per share of $2.22 on revenues of $8.719 billion. Traders and investors will be watching closely to see whether Netflix has been able to retain its client base and gain additional users.
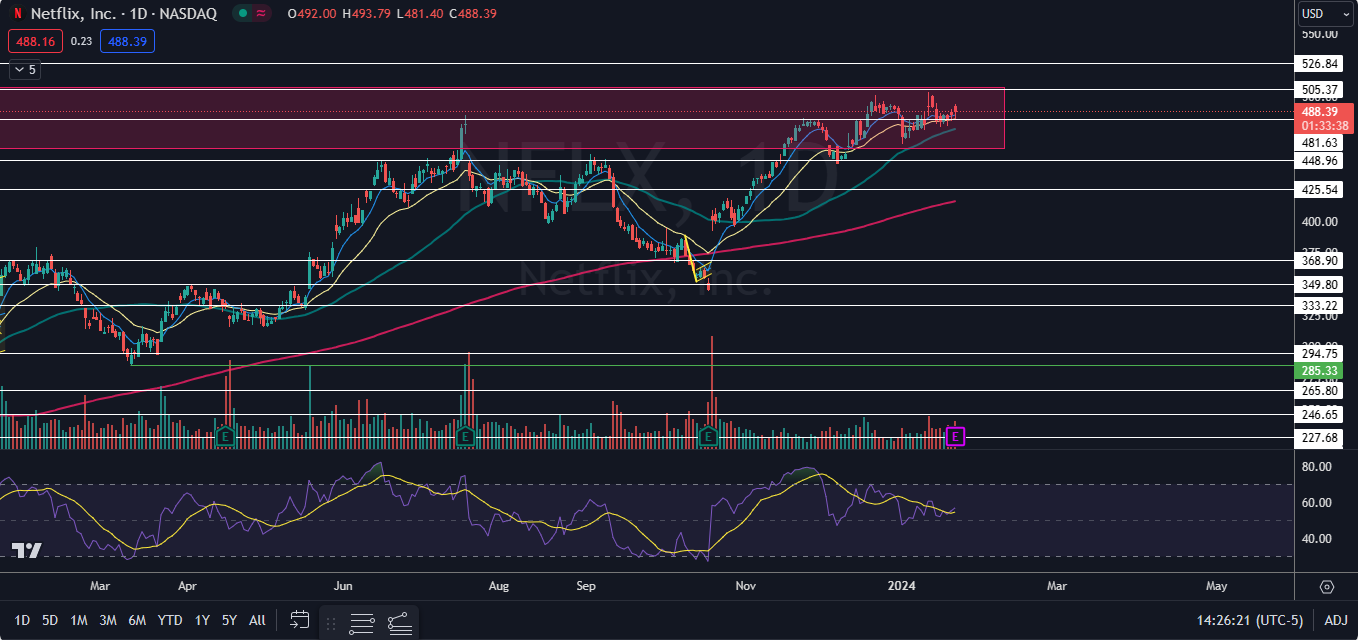
From a technical analysis perspective, Netlix’s stock looks neutral heading into the event, having filled an overhead gap but trading in an uptrend on the daily chart.
It should be noted that holding stocks or options over an earnings print is akin to gambling because stocks can react bullishly to an earnings miss and bearishly to an earnings beat.
Options traders, particularly those who are holding close-dated calls or puts, take on extra risk because the institutions writing the options increase premiums to account for implied volatility.
More experienced traders who wish to play Netflix, combined with several other mega-cap stocks, may choose to do so through the Direxion Daily NYSE FANG+ Bull2X Shares FNGG. The fund seeks daily investment results, before fees and expenses, of 200% of the performance of the NYSE FANG+ Index.
Netflix is the seventh largest holding within the fund, weighted at 9.92%.
It should be noted that leveraged ETFs are meant to be used as a trading vehicle as opposed to long-term investments.
Want direct analysis? Find me in the BZ Pro lounge! Click here for a free trial.
The Netflix Chart: Netflix has been trading in a fairly consistent uptrend on the daily chart since Oct. 18. The most recent higher high was formed on Jan. 11 at $503.41 and the most recent higher low was printed at the $475.26 mark on Jan. 17.
- The upper gap on Netflix’s chart was completely filled when the stock printed its last higher high and Netflix found resistance at the top of that empty trading range. While trading within the gap, Netflix has been holding above the 50-day simple moving average (SMA), which may continue to guide the stock higher and eventually up through the top of the gap.
- If Netflix receives a bullish reaction to its earnings print and bursts up through the $505 mark, the uptrend will remain intact and bullish traders can watch for the stock to eventually print a bearish reverse candlestick, such as a doji or shooting star candlestick to potentially indicate the local top has occurred.
- If the stock suffers a bearish reaction to its print and falls lower on Wednesday, Tuesday’s high-of-day will serve as a lower high, which will negate the uptrend. If that happens, bearish traders want to see Netflix lose support at the 50-day SMA, which could indicate a back test of the 200-day SMA is in the cards.
- Netflix has resistance above at $505.37 and at $526.84 and support below at $481.63 and at $448.96.

- Featured image sourced from Shutterstock
Edge Rankings
Price Trend
© 2025 Benzinga.com. Benzinga does not provide investment advice. All rights reserved.
Trade confidently with insights and alerts from analyst ratings, free reports and breaking news that affects the stocks you care about.