Zinger Key Points
- AXS 2X Innovation ETF is an actively managed double-leveraged ETF.
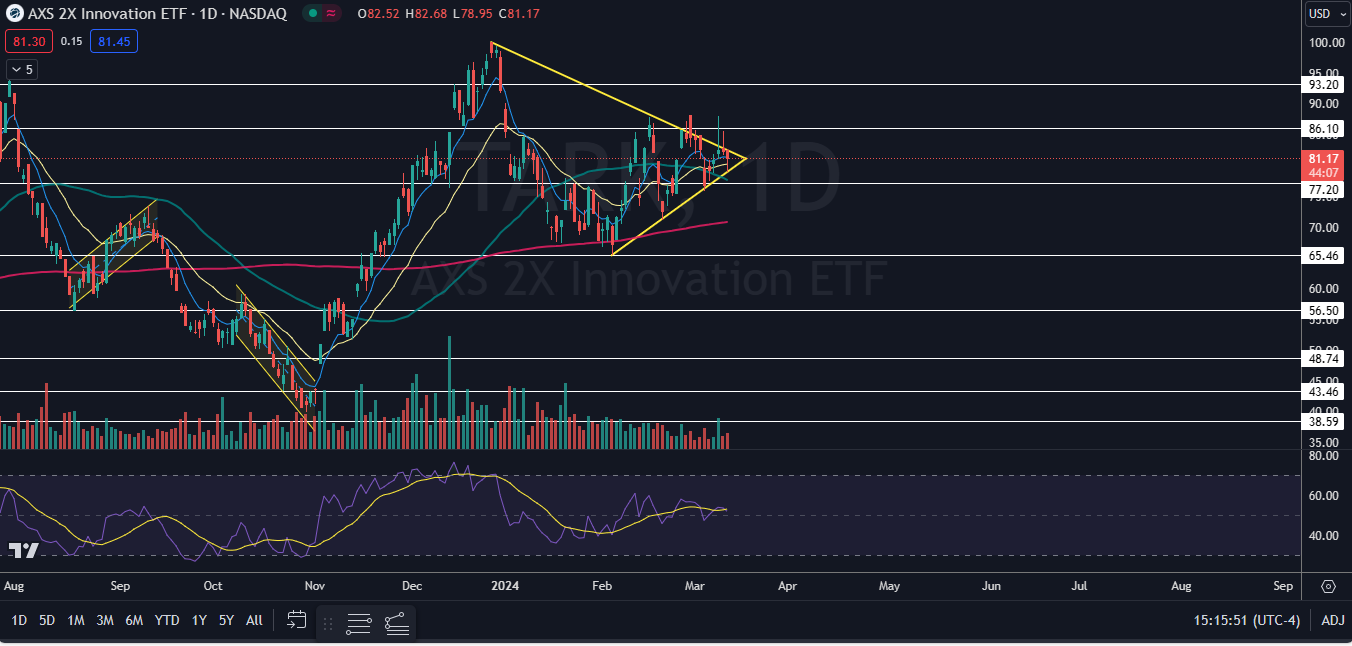
- TARK is trading in a large symmetrical triangle pattern, which leans bullish for a break out.
- Get access to your new suite of high-powered trading tools, including real-time stock ratings, insider trades, and government trading signals.
AXS 2X Innovation ETF TARK was trading slightly lower Tuesday, working its way mostly sideways within a large symmetrical triangle pattern.
TARK is an actively managed double-leveraged ETF aiming to return 200% of the daily performance of Cathie Wood-led ARK Innovation ETF ARKK.
ARKK, and subsequently TARK, have been buoyed recently by the Bitcoin rally because Coinbase Global, Inc COIN is the largest holding within Wood’s ARKK fund, weighted at 10.91%.
Coinbase’s strong 124% rally between Feb. 7 and Tuesday has helped hold ARKK and TARK within a consolidation pattern while ARKK’s other two top holdings, Tesla, Inc TSLA and Roku, Inc ROKU have underperformed this year, falling about 30% each since trading started on Jan. 2.
Trending: Floki Spikes To 27-Month Highs With 69% Rally, Trader Sees It As 'The Next Doge'
TARK is set to meet the apex of its symmetrical triangle on March 18 and traders and investors can watch for the ETF to break up or down from the pattern on higher-than-average volume, to indicate the pattern was recognized and gauge future direction.
Traders who are bearish on ARKK can play AXS Short Innovation Daily ETF SARK. SARK is an actively managed ETF aiming to inversely track the daily performance of ARKK.
Want direct analysis? Find me in the BZ Pro lounge! Click here for a free trial.
The TARK Chart: TARK began trading in a symmetrical triangle on Dec. 27 and has recently been making a series of equal highs and higher lows within the pattern. The pattern leans slightly bullish because TARK has attempted to break up from the pattern multiple times and has respected the lower trend line of the formation on each retracement.
- Since March 6, TARK has been holding above the 50-day simple moving average (SMA), which is trending above the 200-day SMA. This indicates the ETF is currently trading in a bull cycle and a golden cross was confirmed on TARK’s chart on Dec. 22.
- On Tuesday, TARK was looking to print a hammer candlestick, which could indicate the local bottom has occured and the ETF will trade higher on Wednesday. If that happens, TARK will break up from the triangle pattern, indicating an uptrend could be on the horizon.
- Bearish traders want to see big bearish volume come in a drop TARK down under the lower trend line of the triangle. Which could accelerate downside pressure. If that happens, the ETF will lose support at the 50-day SMA and could fall further to test the 200-day as support.
- TARK has resistance above at $86.10 and at $93.20 and support below at $77.20 and at $65.46.

Photo by Scott Graham on Unsplash
© 2025 Benzinga.com. Benzinga does not provide investment advice. All rights reserved.
Trade confidently with insights and alerts from analyst ratings, free reports and breaking news that affects the stocks you care about.