Zinger Key Points
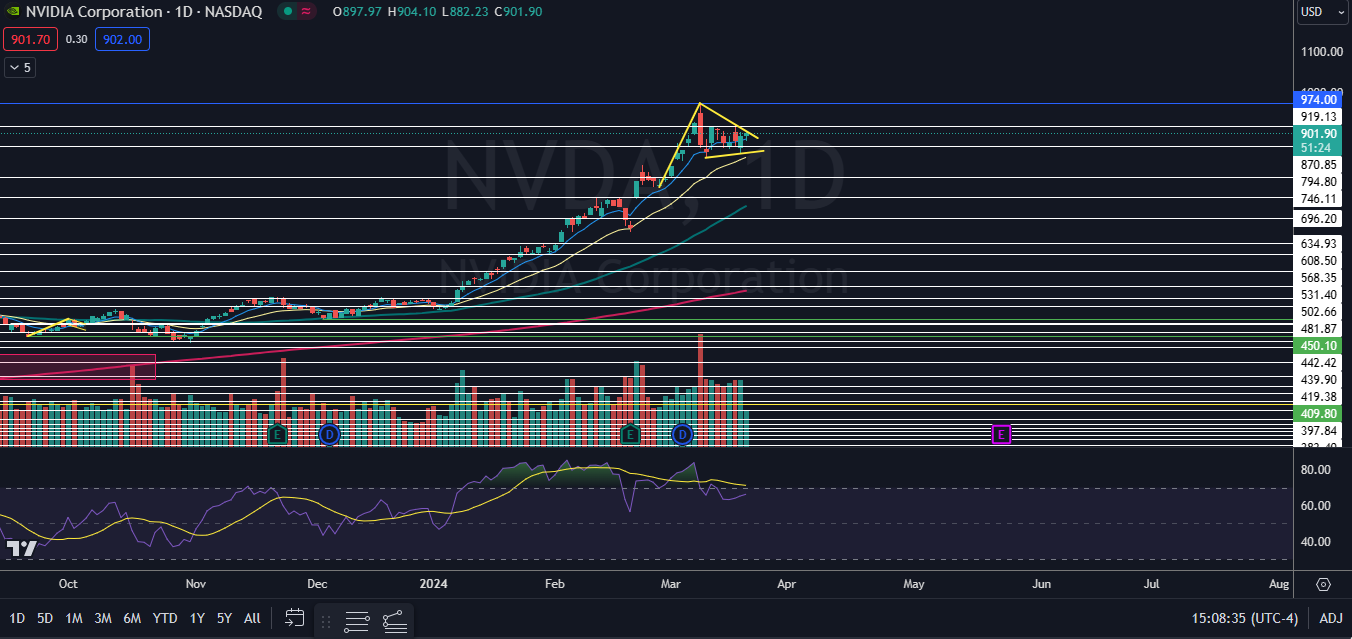
- Nvidia is trading in a possible bull flag pattern, with a measured move of about 26%.
- If the pattern is recognized, Nvidia is likely to surge into blue skies.
- Feel unsure about the market’s next move? Copy trade alerts from Matt Maley—a Wall Street veteran who consistently finds profits in volatile markets. Claim your 7-day free trial now.
NVIDIA Corporation NVDA held steady Wednesday, despite the S&P 500 starting to climb after the Federal Reserve held rates steady at its March policy meeting while indicating the potential for three rate cuts this year.
Nvidia has been consolidating recently after skyrocketing 148% between Oct. 31 and March 8, propelled by strong bullish sentiment in the artificial intelligence market.
On Tuesday, Nvidia’s executives detailed plans at its GTC Conference for various initiatives spanning the company's hardware and software products, unveiling its latest GPU architecture, Blackwell, as a successor to the Hopper architecture. The news caused Nvidia to trade back up into Monday’s trading range after gapping down to start Tuesday’s trading session.
Read Next: Cathie Wood's ARKK Still Leaking, Loses Over 3% In Value And 2% Of Net Assets In A Week
Trending: Intel's CHIPS Act Funding Could Mean Profits For 3 Congress Members
From a technical analysis perspective, Nivida’s recent consolidation is needed, and the mostly sideways trading has helped to lower the stock’s relative strength index (RSI), which had been measuring in overbought territory between Jan. 9 and March 8.
Nvidia’s surge, paired with its consolidation pattern, has caused the stock to form a possible bull flag pattern on the daily chart. If the pattern is recognized, and Nvidia flies into blue skies over the coming weeks, traders and investors could choose to play the move higher, with diversification, through the Spear Alpha ETF SPRX.
SPRX is an actively managed fund offering investors the opportunity to achieve more than passive tracking of the broader market. Some of the fund's most popular holdings include Nvidia, weighted at 10.59% and Advanced Micro Devices, Inc AMD weighted at 8.06%.
Want direct analysis? Find me in the BZ Pro lounge! Click here for a free trial.
The Nvidia Chart: Nvidia has made a series of bull flags during its month-long ascent, with the most recent formation created between Feb. 28 and Wednesday. The measured move, if Nvidia eventually breaks up from the triangular-shaped flag on higher-than-average volume is about 26%, suggesting the stock could soar toward about the $1,072 mark.
- Momentum has been steadily decreasing into Nvidia, which has allowed its RSI to drop to about the 65% level. If Nvidia continues to trade mostly sideways within the flag for a longer period of time, it would give the stock more room to climb upward before its RSI becomes overextended again.
- Bullish traders want to see Nvidia break up from the upper descending trend line of the flag and break above the March 8 all-time high of $974. Bearish traders want to see selling accelerate and for Nvidia to close a trading day below the 21-day exponential moving average, which would negate the bull flag.
- Nvidia has resistance above at $919,13 and at the all-time high and support below at $870.85 and at $794.80.

Featured image sourced from Shutterstock
Edge Rankings
Price Trend
© 2025 Benzinga.com. Benzinga does not provide investment advice. All rights reserved.
Trade confidently with insights and alerts from analyst ratings, free reports and breaking news that affects the stocks you care about.