Zinger Key Points
- Copper is trading in a descending channel, which may indicate a longer-term rebound is on the horizon.
- Economist Patricia Mohr sees an uptick in copper prices this year.
- Today's manic market swings are creating the perfect setup for Matt’s next volatility trade. Get his next trade alert for free, right here.
As the global shift toward greener energy alternatives gains momentum, Patricia Mohr, an economist, commodities expert and former vice president at Scotiabank, predicts a resurgence in demand for essential metals.
During an interview at the recent Prospectors And Developers Association of Canada (PDAC) conference, Mohr highlighted her optimism for both copper and uranium, specifically.
With copper's pivotal role in electricity generation across various energy sectors, including renewables, Mohr called for a significant uptick in its price. Additionally, her bullish outlook extends to uranium, suggesting a potential rise in demand for this metal as well.
Read Next: China Approves Largest Copper Mine In The World In Its Bid To Outpace US
For traders and investors looking to take a position in the base metals sector, Teucrium’s AiLA Long-Short Base Metals Strategy ETF OAIB is an option. This ETF focuses on vital commodities and employs a market-neutral strategy, aiming for a positive return irrespective of market direction.
OAIB follows the AiLA-S022 index, a well-established and sophisticated benchmark. Over the period from 2017 to 2023, AiLA-S022 demonstrated an annualized return of 12.65%. AiLA employs a systematic methodology, leveraging proprietary machine-learning technology to achieve these results.
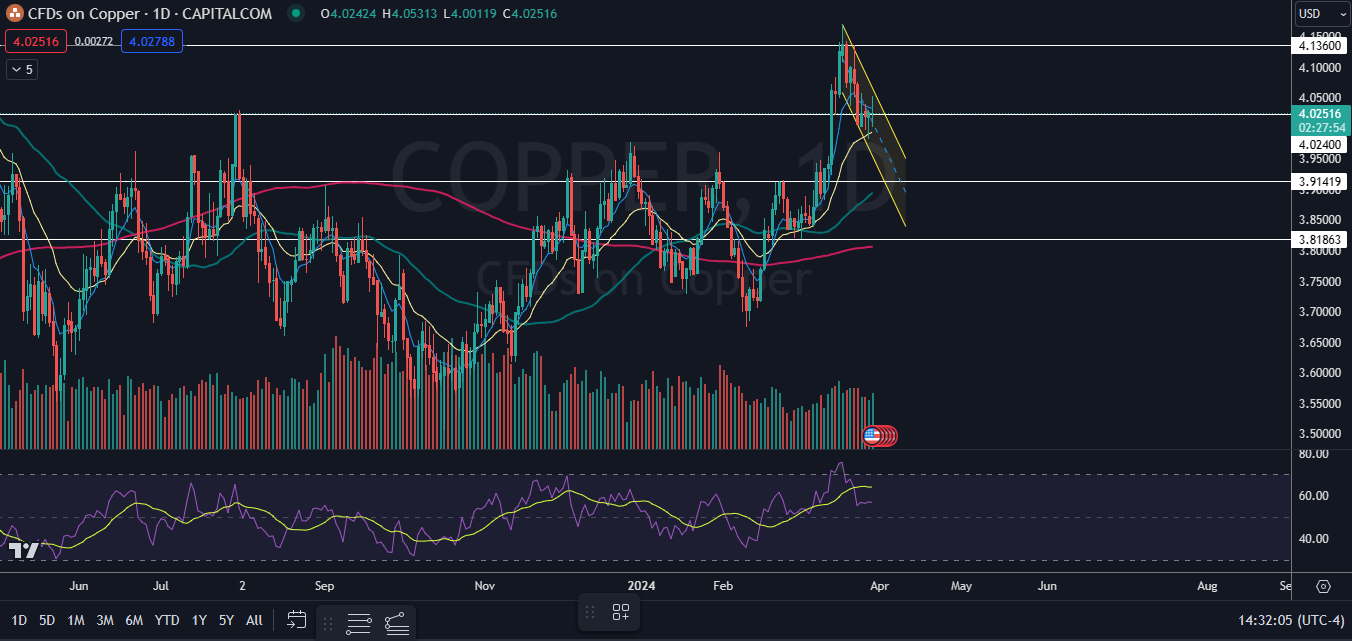
In terms of copper, from a technical analysis standpoint, the commodity looks to be headed higher over the medium-to-long term, because copper is trading in a descending channel pattern on the daily chart:
Want direct analysis? Find me in the BZ Pro lounge! Click here for a free trial.
The Copper Chart: Copper started to trade in a descending channel on March 18, and within the formation, the commodity has been making a series of lower highs and lower lows. The most recent lower high was formed on March 21 at $4.13 and the most recent lower low was printed at the $3.98 mark on Wednesday.
- On Thursday, copper was looking to print a long-legged doji candlestick on the daily chart. The long-legged doji indicates the bulls and the bears are battling for control. It could also indicate the local top has occurred and a retracement is on the horizon. If that happens, Thursday’s high-of-day will serve as the next lower high within the downtrend.
- Descending channel patterns are considered bearish for the short term but can be bullish down the road. When a stock or commodity breaks up from a descending channel on higher-than-average volume, it can indicate a longer-term reversal to the upside is on the horizon.
- Copper has resistance above at $4.13 and at $4.23 and support below at $4.02 and at $3.91.

Image sourced from Shutterstock
© 2025 Benzinga.com. Benzinga does not provide investment advice. All rights reserved.
Trade confidently with insights and alerts from analyst ratings, free reports and breaking news that affects the stocks you care about.