


Zinger Key Points
- AMC has a 52-week high of $72.62 and a 52-week low of $8.93.
- Markets are messy—but the right setups can still deliver triple-digit gains. Join Matt Maley live this Wednesday at 6 PM ET to see how he’s trading it.
AMC Entertainment Holdings, Inc AMC was trading slightly lower in the premarket on Thursday, after lagging the general markets on Wednesday, where a number of individual stocks surged following the Federal Reserve’s decision to raise interest rates by 0.5%.
Although the S&P 500 shot up 3%, AMC closed a modest 1.35% higher. The theater chain has been stuck in a tight sideways range between about $14.68 and 16.25 for the last six trading days, as the company approaches its quarterly earnings.
On Monday, AMC will print its first-quarter financial results. Analysts estimate AMC will report a loss of 63 cents per share on revenues of $736.230 million for the quarter.
When the company printed a fourth-quarter beat on March 1, AMC closed the following two trading days flat to its pre-reporting price. For that quarter, AMC reported a net loss of 11 cents per share on revenues of $1.17 billion, which beat the consensus estimate of a loss of 26 cents per share on revenues of $1.09 billion.
Want direct analysis? Find me in the BZ Pro lounge! Click here for a free trial.
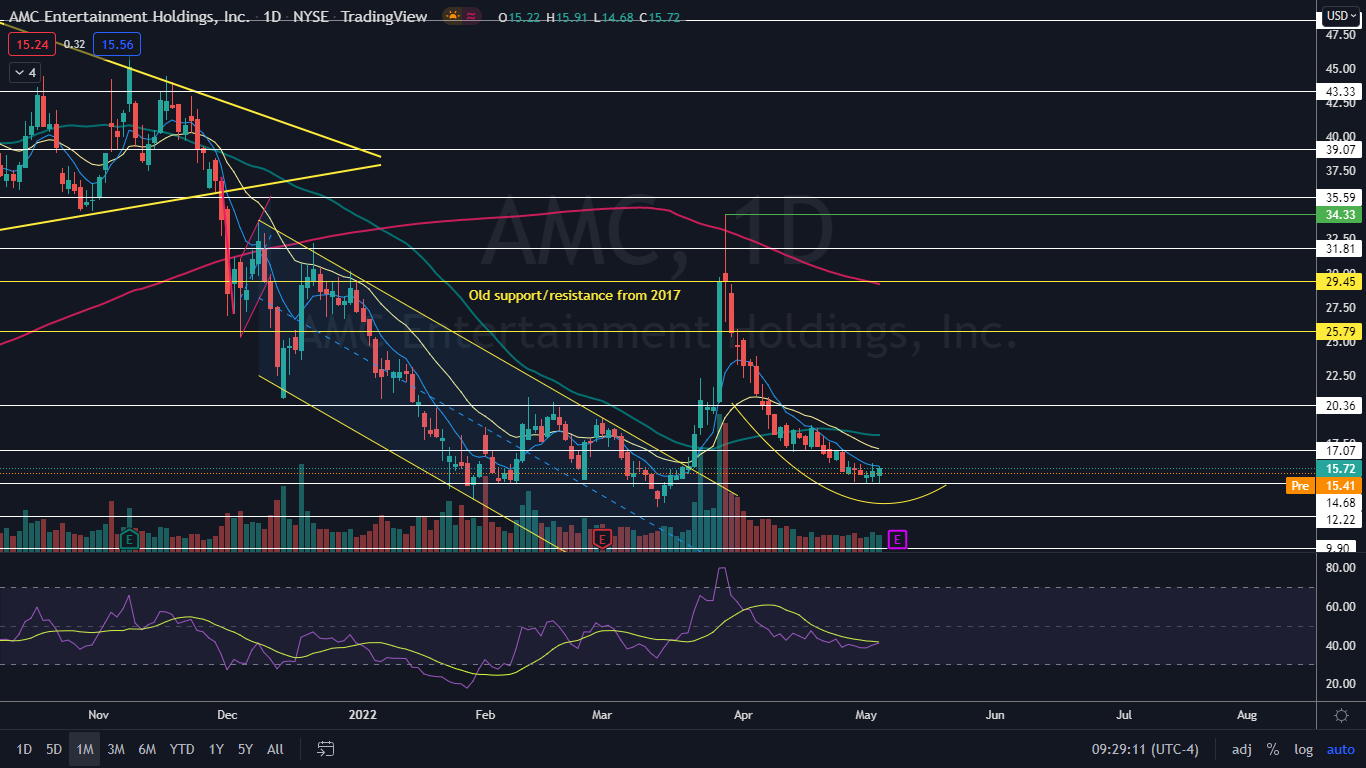
The AMC Chart: On four of the last five trading days, AMC has tested a support level near the $14.70 mark and bounced higher, creating a quadruple bottom pattern. The pattern is bullish but the reaction is possibly being hampered by the stock’s approaching earnings print.
The eight-day exponential moving average, which is hovering directly on top of AMC’s last three candles, is also acting as strong resistance in keeping AMC stuck in its tight trading range.
- The initial sharp decline from the March 29 high of $34.33 has slowed and begun to curl slightly, possibly creating a rounded bottom pattern. If the rounded bottom continues to play out and AMC begins to rebound, it could signal a long-term reversal to the upside.
- Bullish traders can watch for continued consolidation on low volume and then for big bullish volume to come in on a reaction to the quadruple bottom pattern, to cause the stock to curl upwards into an uptrend. Bearish traders will want to see AMC break down through support at 14.68, which would indicate the downtrend is still in play.
- AMC has resistance above at $17.07 and $20.36 and support below at $14.68 and $12.22.
See Also: Robinhood Allows Users To Lend Stock: What Investors Need To Know
Edge Rankings
Price Trend
© 2025 Benzinga.com. Benzinga does not provide investment advice. All rights reserved.
Trade confidently with insights and alerts from analyst ratings, free reports and breaking news that affects the stocks you care about.

