Zinger Key Points
- The large spike to the upside on Thursday is likely due to a number of factors.
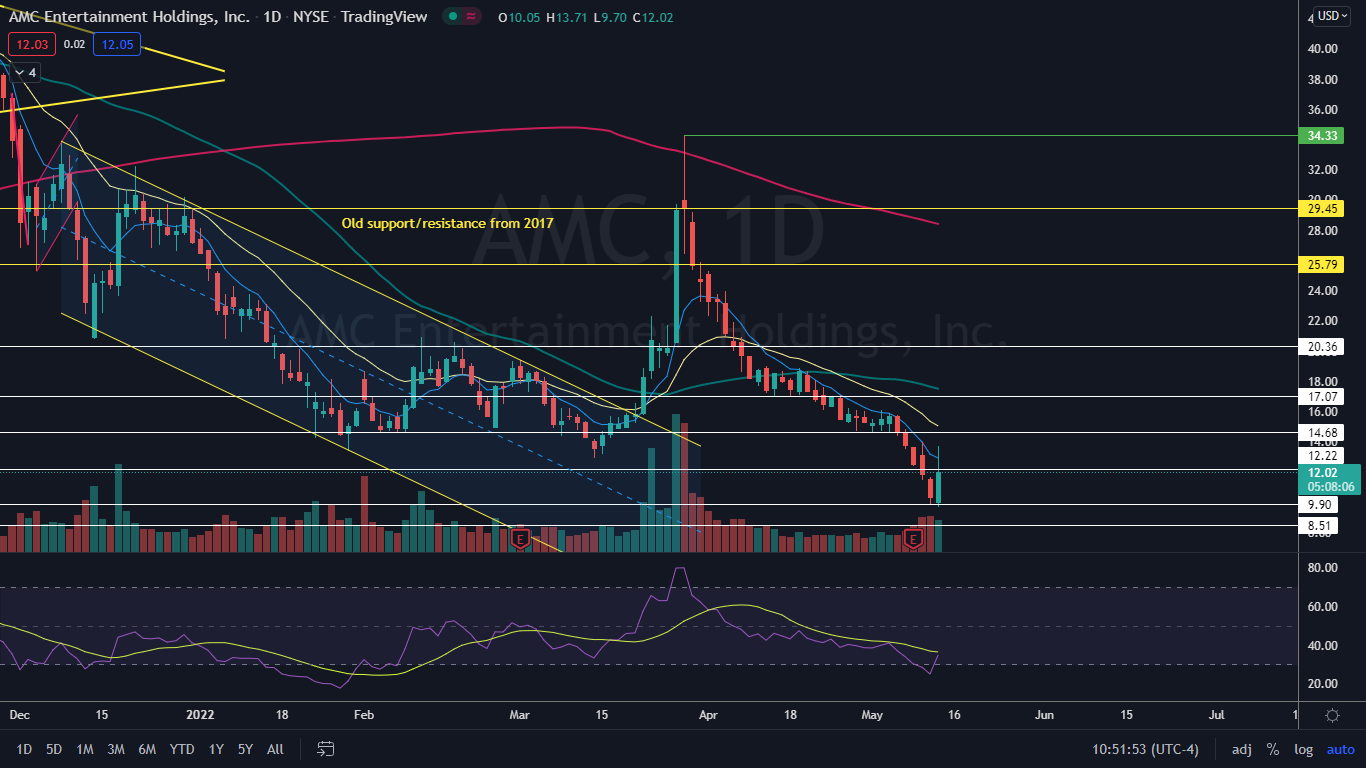
- AMC has resistance above at $12.22 and $14.68 and support below at $9.90 and $8.51.
- Our government trade tracker caught Pelosi’s 169% AI winner. Discover how to track all 535 Congress member stock trades today.
AMC Entertainment Holdings, Inc AMC reached a new 52-week low on Thursday before spiking up to trade 25% higher at one point. The stock has seen relentless downwards pressure as of late, plunging 71% between March 29 and Thursday’s low-of-day at the $9.70 mark.
AMC has become known for its short squeezes, its volatility, its month-long lulls and perhaps most notably for the retail traders (Apes) who’ve “holdled” shares of the theater chain company.
The large spike to the upside on Thursday is likely due to a number of factors:
- AMC and the S&P 500 entered oversold territory, with relative strength index’s measuring in at 25% and 31%, respectively on Thursday morning.
- Counter-trend rallies take place in every market cycle, with bearish reversals happening in bull markets and bullish reversals in bear markets. Both AMC and the S&P 500 had five days in a row with red candles and no relief bounce to the upside.
- AMC’s exaggerated reversal may have been due to some shorts deciding to cover their position. According to the current data that’s available, the percentage of AMC’s float that is held short has been holding fairly steady, but high, at about 19.3%.
Despite AMC developing a recipe for a reversal, it’s difficult to swing or take long-term bullish positions in stocks experiencing a bear cycle. AMC, just like the general markets, hasn’t signaled that the bottom is nearby yet, but for AMC’s bulls, Thursday’s spike demonstrates there is still massive interest in the stock.
For Interest: On Sunday, “Diamond Hands: The Legend of WallStreetBets” will premiere at 10 p.m. EDT on MSNBC. The movie focuses on the younger-generation retail trader and how they view the markets and financial institutions.
Want direct analysis? Find me in the BZ Pro lounge! Click here for a free trial.
The AMC Chart: AMC’s surging share price on Thursday came on higher-than-average volume, which indicates a high level of investor and trader interest. In the first hour of trading, over 35 million AMC shares exchanged hands compared to the 10-day average of 34.79 million.
- AMC is trading in a downtrend, with the most recent lower high printed on May 10 at $14.01 and the most recent confirmed lower low formed at the $11.50 mark on that same day. When AMC surged higher on Thursday, the stock didn’t quite reach the most recent lower high, which confirms the downtrend is still intact.
- Friday’s candlestick will need to print for confirmation, but there’s a possibility the price action on Wednesday and Thursday in the $9 range has created a bullish double bottom pattern on the daily chart. If the pattern is recognized, AMC is likely to trade higher over the next few trading days, which could set the stock into an uptrend.
- AMC has resistance above at $12.22 and $14.68 and support below at $9.90 and $8.51.

See Also: Analyst Reiterates $1 Price Target On AMC Entertainment After Q1 Beat: Here's Why
© 2025 Benzinga.com. Benzinga does not provide investment advice. All rights reserved.
Trade confidently with insights and alerts from analyst ratings, free reports and breaking news that affects the stocks you care about.