Zinger Key Points
- Nvidia has a 52-week high of $346.47 and a 52-week low of $135.43.
- Find out which stock just plummeted to the bottom of the new Benzinga Rankings. Updated daily—spot the biggest red flags before it’s too late.
NVIDIA Corporation NVDA plunged over 6% during Wednesday’s trading session in sympathy with the S&P 500, which shed 4%.
The technology sector has taken a beating over recent weeks as traders and investors have weighed how the Federal Reserve’s decision to raise interest rates and begin quantitative tightening, scheduled to begin on June 1, will impact the market.
On May 25, Nvidia is expected to print its first-quarter earnings. When the company reported fourth-quarter and fiscal year 2021 financial results on Feb. 16, it guided first-quarter revenue of $8.1 billion, which came in above the consensus estimate of $7.29 billion.
On Thursday analysts began to weigh in on the chipmaker. Oppenheimer maintained an Outperform rating on the stock but lowers its price target to $300. The new price target suggests about 77% upside potential for Nvidia shares.
Want direct analysis? Find me in the BZ Pro lounge! Click here for a free trial.
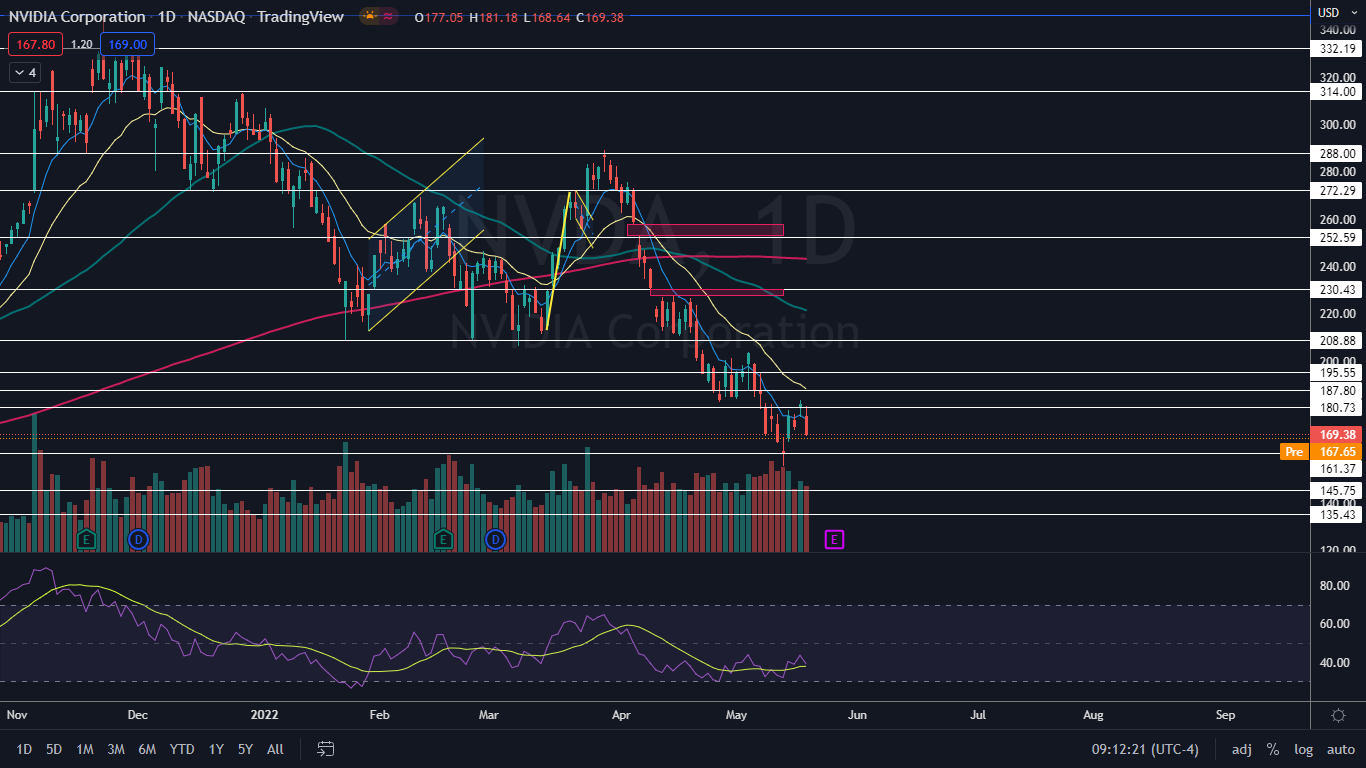
The Nvidia Chart: Nivida has been trading in a steep and consistent downtrend since March 29, losing 41% of its value since reaching the $289.46 mark on that date. Nvidia’s most recent lower high was printed on Tuesday at $183.71 and the most recent confirmed lower low was printed at the $155.67 level on May 12.
- Bullish traders wishing to play Nivida counter-trend will need to be agile and patient, watching for a reversal candlestick, such as a doji or hammer candlestick, to develop in order to catch the brief rallies that take place to form subsequent lower highs. Bullish traders can also be prepared if Nvidia prints a double bottom level at the most recent lower low, which could signal a reversal.
- Bears traders who are already in a position will want to see sustained bearish volume continue to push Nvidia lower. The candlestick Nvidia printed on Wednesday, which closed at the low-of-day, suggests lower prices are likely in the cards for Thursday.
- Nvidia has two gaps above on its chart, with the first between $227.77 and $230.62 and higher gap between the $253 and $258.20 range. Gaps on charts fill about 90% of the time, which makes it likely Nvidia will trade up to fill the empty range in the future but it could be a long period of time before that happens.
- Nvidia has resistance above at $180.73 and $187.80 and support below at $161.37 and $145.75.

See Also: Nvidia Q4 Earnings Beat Estimates On Strong Data Center, Gaming Demand
Edge Rankings
Price Trend
© 2025 Benzinga.com. Benzinga does not provide investment advice. All rights reserved.
Trade confidently with insights and alerts from analyst ratings, free reports and breaking news that affects the stocks you care about.