


Zinger Key Points
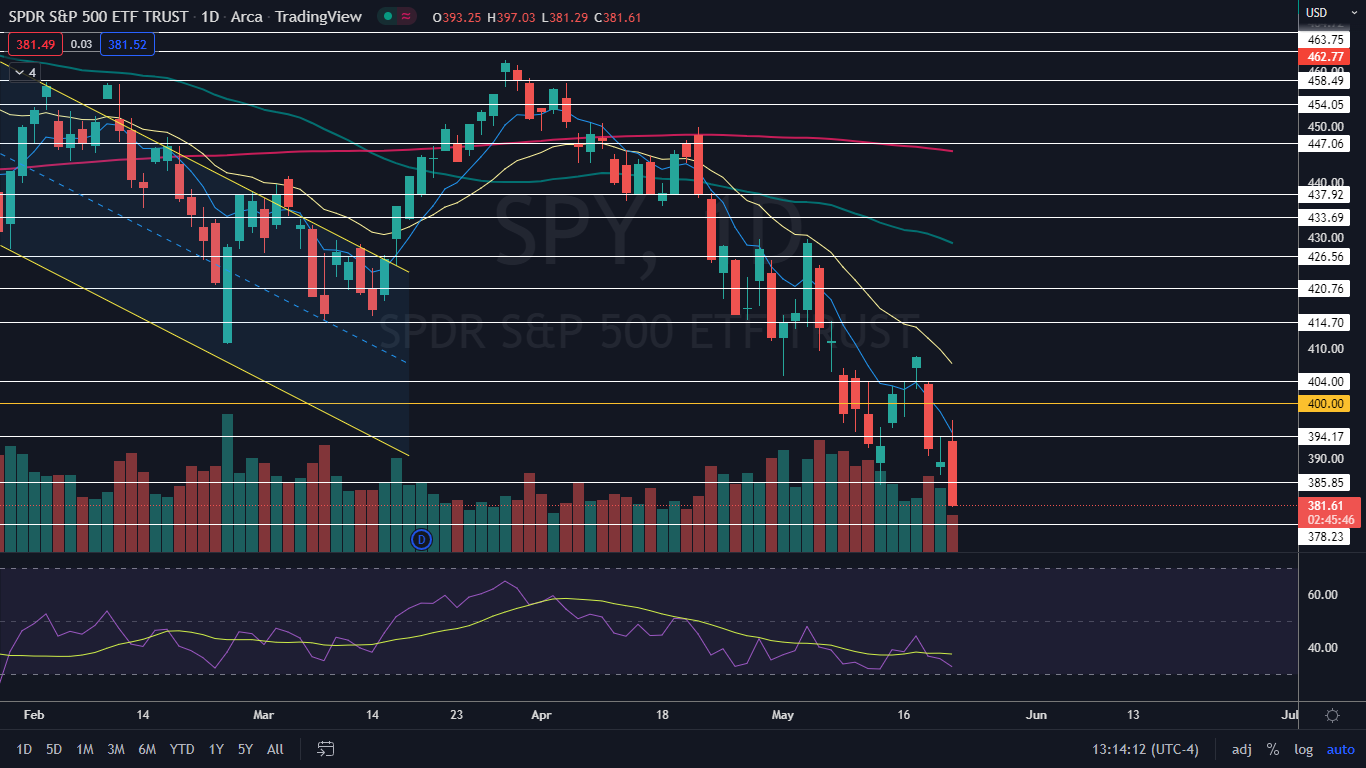
- The SPY has resistance above at $385.85 and $394.17 and support below at $378.23 and $370.88.
- When a stock or ETF drops too much too fast, the bounce to the upside can be a big one.
- Today's manic market swings are creating the perfect setup for Matt’s next volatility trade. Get his next trade alert for free, right here.
The S&P 500 ETF Trust SPY was plunging on Friday to end another bearish week in the markets.
The SPY has closed each of the last seven weeks lower than the previous week, creating seven red weekly candlesticks in a row — an event that rarely occurs. In the history of the market, multiple consecutive bearish weeks are often followed by a bullish reversal, at least temporarily, to the upside.
Looking back to the year 1993, a pattern of this type of market behavior has developed:
- Between the weeks beginning Sept. 5, 2000 through Oct. 9, 2000, the SPY formed six red weekly candles, which brought the ETF down 12.76%. Over the three weeks that followed, the SPY rose 7.53%.
- Between the weeks beginning Jan. 29, 2001 through March 19, 2001, the SPY plummeted 21.32% lower and formed eight red weekly candles. The ETF shot up 20.09% over the subsequent eight weeks.
- Between the weeks beginning June 2, 2008 through July 7, 2008, the ETF printed six red weekly candles and plunged 13.06%, which was followed by a more modest 9.57% spike to the upside over the five following weeks.
Going back almost 30 years, the SPY has yet to ever form more than eight red weekly candles, including during the crash caused by the onset of the COVID-19 pandemic, where the SPY formed just four consecutive red weekly candles. This makes it likely that at least a relief bounce to the upside will be in the cards either next week or the week after.
Over the last seven weeks the SPY has plummeted over 15% and dropped through the psychologically important $400 level with little difficulty, showing the bears are firmly in control. Although this is the case, there are signs the bears may be hitting exhaustion levels:
- The U.S. Dollar Currency Index (DXY) failed to break up above the $1.05 level and has now retraced about 1.85%. The DXY has a strong inverse correlation to the SPY.
- The U.S. Government Bonds 10 YR Yield, which also correlates inversely to the SPY, has begun to show bearish pressure, falling 1.9% lower on Friday and a total of over 12% over the last 10 trading days. The 10 YR Yield hit a four-year high of $3.20 on May 9.
On Friday, the SPY hit weekly oversold levels, with a relative strength index of 28%. The SPY has not reached weekly oversold conditions since the week of March 16, 2020 and the time before that was the week of March 2, 2009. In both of the previous two cases, the SPY reversed course over the weeks that followed.
It should be noted there are few signals other than SPY’s RSI to indicate the bottom is in, and RSIs can remain oversold for long periods of time. It is safe to say, however, that stocks and ETF’s never go straight down, which contributes to the idea that a bounce is likely on the horizon.
Want direct analysis? Find me in the BZ Pro lounge! Click here for a free trial.
The SPY Daily Chart: The SPY is trading in a steep downtrend and on Friday formed another lower low, which is under the most recent lower low of $385.15 formed on May 12. If the SPY closes the trading day near its low-of-day price, it will print a bearish engulfing candlestick, which could indicate lower prices will come again on Monday.
- The second most likely scenario is that an inside bar will form on Monday, which would lean bearish because the ETF was trading lower before forming the pattern. Inside bars usually take place on lower-than-average volume and indicate consolidation.
- Bulls want to watch for a reversal candlestick to print on the daily chart, such as a doji or hammer candlestick, which could indicate a bounce to the upside is in the cards. Bears who aren’t already in a position can watch for a doji or shooting star candlestick to form on the next lower high for a solid position.
- The SPY has resistance above at $385.85 and $394.17 and support below at $378.23 and $370.88.
When a stock or ETF drops too much too fast, the bounce to the upside can be a big one, but as the old saying goes, “don’t catch a falling knife.”
 See Also:
 Edge Rankings
Price Trend
© 2025 Benzinga.com. Benzinga does not provide investment advice. All rights reserved.
Trade confidently with insights and alerts from analyst ratings, free reports and breaking news that affects the stocks you care about.

