Zinger Key Points
- CURE is a triple leveraged fund that is designed to outperform 72 U.S. companies in the home healthcare sector.
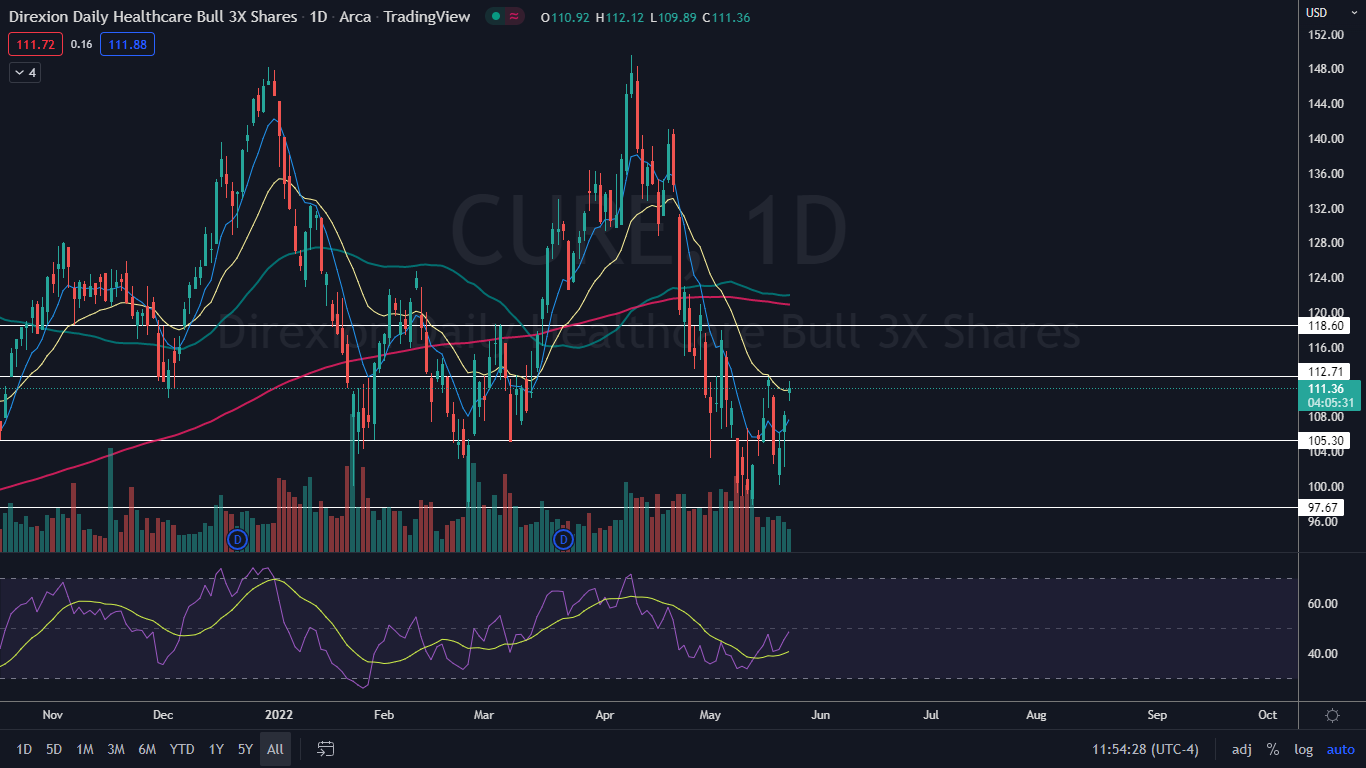
- CURE has resistance above at $112.71 and $118.60 and support below at $105.30 and $97.67.
- Pelosi’s latest AI pick skyrocketed 169% in just one month. Click here to discover the next stock our government trade tracker is spotlighting—before it takes off.
The Direxion Daily Healthcare Bull 3X Shares CURE gapped up almost 2.52% higher on Monday in response to outbreaks of monkeypox being reported in several western nations.
CURE is a triple leveraged fund that is designed to outperform 72 U.S. companies in the home health care sector. The index includes a variety of companies including biotechnology, pharmaceuticals, health care equipment, supplies and technology developers and suppliers.
Some of the more familiar names in the ETF include Johnson & Johnson JNJ, weighted at 7.03%; Pfizer Inc. PFE, weighted at 4.36%; and Thermo Fisher Scientific Inc. TMO, weighted at 3.33%.
It should be noted that leveraged ETFs are meant to be used as a trading vehicle as opposed to a long-term investment.
Want direct analysis? Find me in the BZ Pro lounge! Click here for a free trial.
The CURE Chart: CURE reversed course into an uptrend after printing a bullish double bottom pattern on Feb. 24 and May 12 at the $97.67 level. The uptrend on CURE’s chart was confirmed on May 19, when the ETF printed a higher low at $100.18.
- On Monday, CURE was attempting to work to rise up to print a higher high above the May 17 high of $112.58. Bullish traders and investors will want to see that happen before CURE makes another low, which would negate the uptrend.
- CURE regained the support of the 21-day exponential moving average (EMA) on Monday, which is a positive sign for the bulls. When the ETF prints its last high it rejected the 21-day, which caused CURE to fall over 10% to print its higher low.
- If CURE can remain trading above the 21-day EMA for a period of time, the eight-day EMA will cross above the 21-day, which would give bullish traders more confidence going forward. The 50-day simple moving average (SMA) hasn’t crossed below the 200-day SMA yet, which means CURE has, so far, avoided a death cross from occurring on its chart.
- If CURE closes the trading day near its high-of-day price, it’s likely the ETF will trade higher on Tuesday to print a higher high. If the ETF closes flat or near its low-of-day price, CURE will print a doji candlestick or shooting star candlestick, respectively, which could indicate lower prices are on the horizon.
- CURE has resistance above at $112.71 and $118.60 and support below at $105.30 and $97.67.
Edge Rankings
Price Trend
© 2025 Benzinga.com. Benzinga does not provide investment advice. All rights reserved.
Trade confidently with insights and alerts from analyst ratings, free reports and breaking news that affects the stocks you care about.
 See Also: