


Zinger Key Points
- Snap’s plunge to near the $15 level will drop its relative strength index into severely oversold territory.
- Snap is likely to finally fill a lower gap, which was left behind in April 2020 between $13.04 and $14.85.
- Today's manic market swings are creating the perfect setup for Matt’s next volatility trade. Get his next trade alert for free, right here.
Snap, Inc SNAP was plummeting over 33% in the premarket on Tuesday, in addition to a 43% plunge that took place between April 5 and Monday.
The parent company of Snapchat filed a form 8-K with the U.S. Securities and Exchange Commission to lower its previously-issued guidance for the second quarter. When Snap originally issued its guidance for the quarter on April 21, the company forecast second-quarter revenues to come in 20% to 25% above the same period the year prior.
"The macroeconomic environment has deteriorated further and faster than anticipated," the company said in the filing. Snap, like many companies across sectors, is affected by inflation and rising interest rates, but the change in Snap’s guidance only weeks after it was issued flashes warning signs for investors who hoped the tech sector could boost the markets.
Meta Platforms, Inc FB and Pinterest, Inc PINS reacted negatively to Snap’s news, plunging over 8% and 18%, respectively, in the premarket
Want direct analysis? Find me in the BZ Pro lounge! Click here for a free trial.
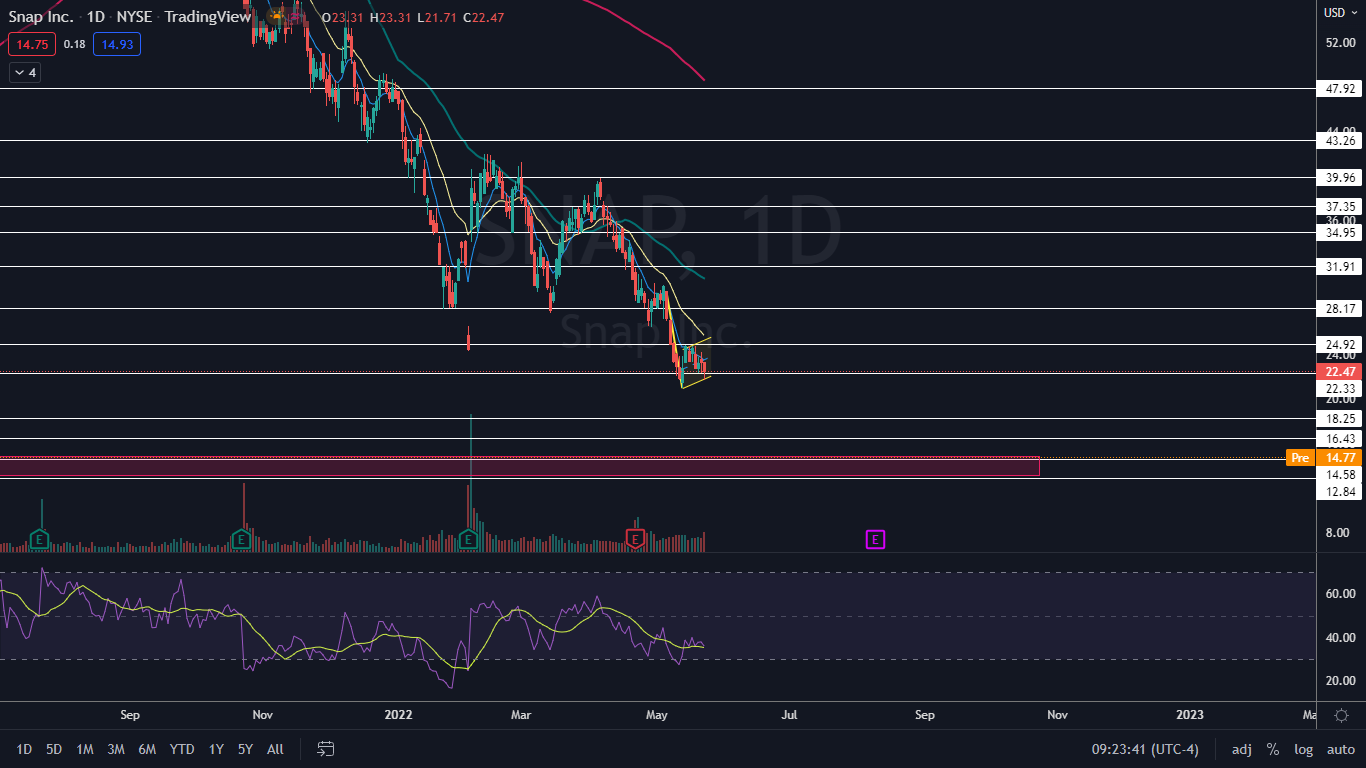
The Snap Chart: Despite the negative reaction to Snap’s guidance, the stock already looked set to fall because it had developed a bear flag on the daily chart. The downward sloping pole of the pattern was created between May 5 and May 12 and the flag was formed over the trading days since.
- The measured move of the break of the bear flag is about 30%, which indicated Snap could trade down toward the $17 mark. The move is escalated by the bad news, however.
- A bounce to the upside, even temporarily, is likely to come in the immediate future because Snap’s plunge to near the $15 level will drop its relative strength index (RSI) into severely oversold territory. When a stock’s RSI reaches or falls below the 30% mark, it can signal a buying opportunity for traders looking to catch a bounce.
- Conservative bullish and bearish traders will want to wait patiently for Snap to consolidate after a likely period of high volatility on Tuesday. When a stock moves violently to the upside or downside, it’s often followed by a period of sideways trading.
- Interestingly, Snap is likely to finally fill a lower gap on its chart, which was left behind in April 2020 between $13.04 and $14.85. Gaps on charts fill about 90% of the time, so it was the most likely scenario that Snap would eventually fall back into the empty trading range. The stock also has an upper gap between $60.78 and $73.89, which will also likely fill in the future.
- Snap has resistance above at $16.43 and $18.25 and support below at $14.58 and $12.84.
Edge Rankings
Price Trend
© 2025 Benzinga.com. Benzinga does not provide investment advice. All rights reserved.
Trade confidently with insights and alerts from analyst ratings, free reports and breaking news that affects the stocks you care about.

