Zinger Key Points
- Technically speaking, Twitter looks the strongest of the three.
- Elon Musk’s teetering acquisition of Twitter makes it a risky trade from a fundamental viewpoint.
- Get Wall Street's Hottest Chart Every Morning
Meta Platforms, Inc FB, Twitter, Inc TWTR and Pinterest, Inc PINS gapped down about 8%, 2% and a whopping 17%, respectively, to start the trading day on Tuesday.
The social media stocks were trading lower in sympathy with Snap, Inc SNAP, which filed a Form 8-K on Monday showing the parent company of Snapchat forecast its second-quarter revenues to come in under the lowest range of its guidance issued on April 21. The news caused Snap to plunge over 40% intraday.
Investors have grown concerned Snap’s outlook for the second quarter is indicative of the sector in general, as soaring inflation and rising interest rates appear to be slowing the economy, which will impact advertisement revenue as consumers limit their spending.
All three stocks are trading in confirmed downtrends, which makes upside potential short-lived for bullish investors due to playing counter-trend.
A bounce is likely to come in the near-term, as Facebook, Twitter and Pinterest are approaching oversold territory and have printed lower lows, which are usually followed by a rise up to print a lower high.
Technically speaking, Twitter looks the strongest of the three, because of its comparatively muted response to Snap’s news. Elon Musk’s teetering acquisition of the micro-blogging website makes Twitter a risky trade from a fundamental viewpoint.
It should be noted that events affecting the general markets, negative or positive reactions to earnings prints and news headlines can quickly invalidate patterns and breakouts. As the saying goes, "the trend is your friend until it isn't," and any trader in a position should have a clear stop set in place and manage their risk versus reward.
Want direct analysis? Find me in the BZ Pro lounge! Click here for a free trial.
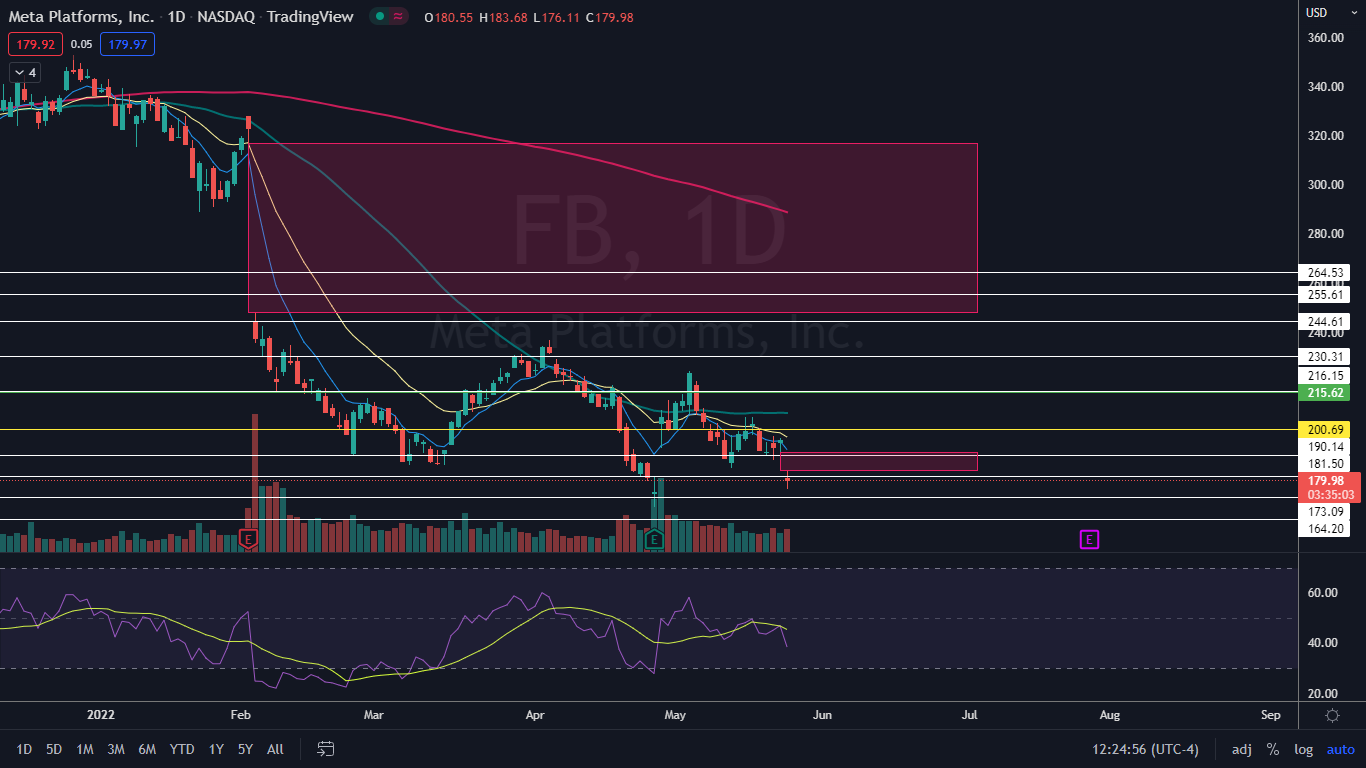
The Facebook Chart: Facebook’s current downtrend began on May 17, with the most recent lower high printed on Monday at $196.99 and the most recent low formed at the $187.87 on May 20. On Tuesday, Facebook was working to print its next possible lower low at the $176.11 mark.
- The price action may be the next lower low. As of press time, Facebook was printing a doji candlestick on the daily chart. A doji candlestick, when formed at the bottom of a downtrend, can indicate a reversal to the upside is in the cards.
- Facebook has two gaps above on its chart, with the first left behind on Tuesday between $183.68 and $191.24 and the second higher gap between $248 and $316.87. Gaps on charts fill about 90% of the time, making it likely the stock will trade up to fill the empty ranges in the future, but the closest gap is the most likely to fill.
- Facebook has resistance above at $181.50 and $190.14 and support below at $173.09 and $164.20.
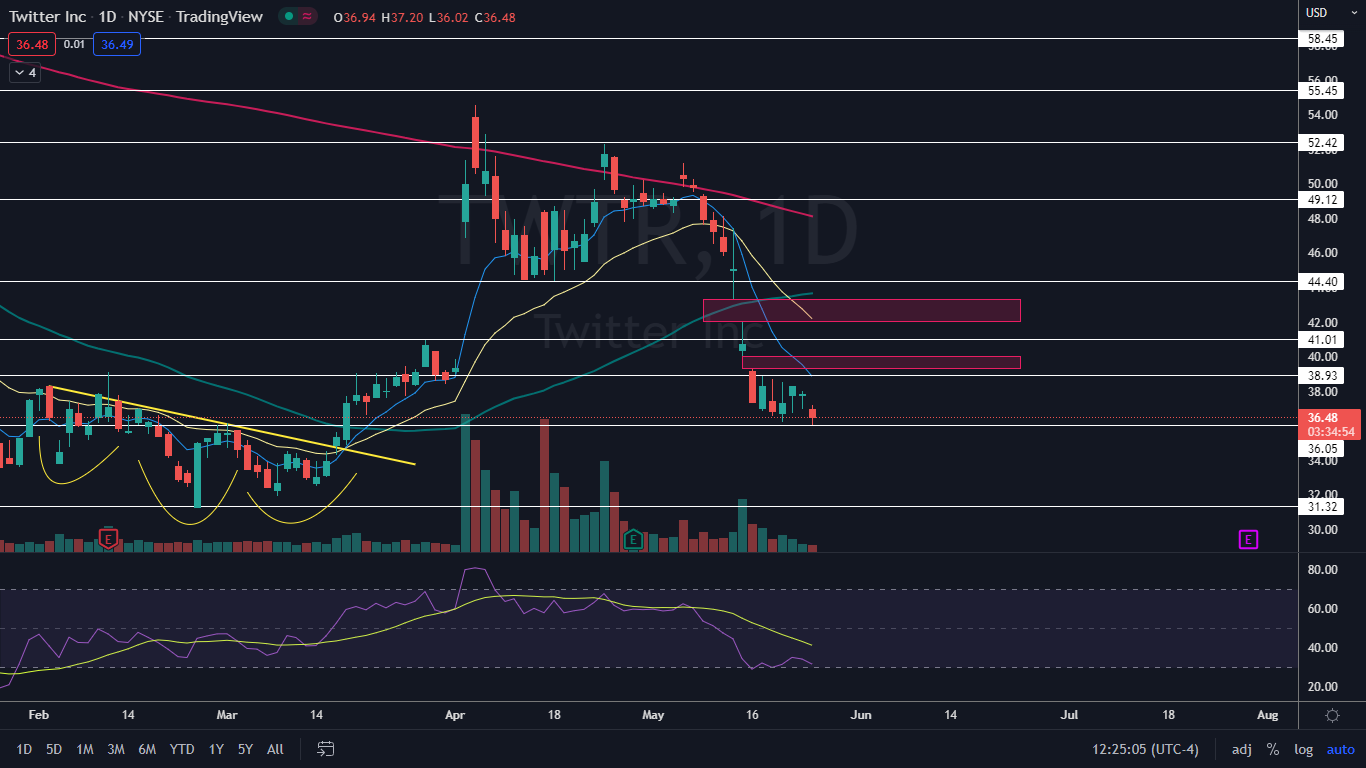
 The Twitter Chart: Twitter’s downtrend began on April 25 and the stock’s most recent lower high was printed on May 20 and $38.29 and the most recent confirmed lower low was printed at $36.20 on May 19. On Tuesday, Twitter printed another lower low but because the low at the $36.02 level is so close to the last lower low, Twitter may have formed a bullish double bottom pattern.
- Like Facebook, Twitter was also working to print a doji candlestick, which could indicate a bounce to the upside is in the cards for Wednesday. If the stock can rise above the most recent lower high on the next bounce, the downtrend will be negated.
- Also, similarly to Facebook, Twitter has two gaps above on its chart. The first is between $39.29 and $40.01 and the second falls between the $42 and $43.33 mark.
- Twitter has resistance above at $38.93 and $41.01 and support below at $36.05 and $31.32.
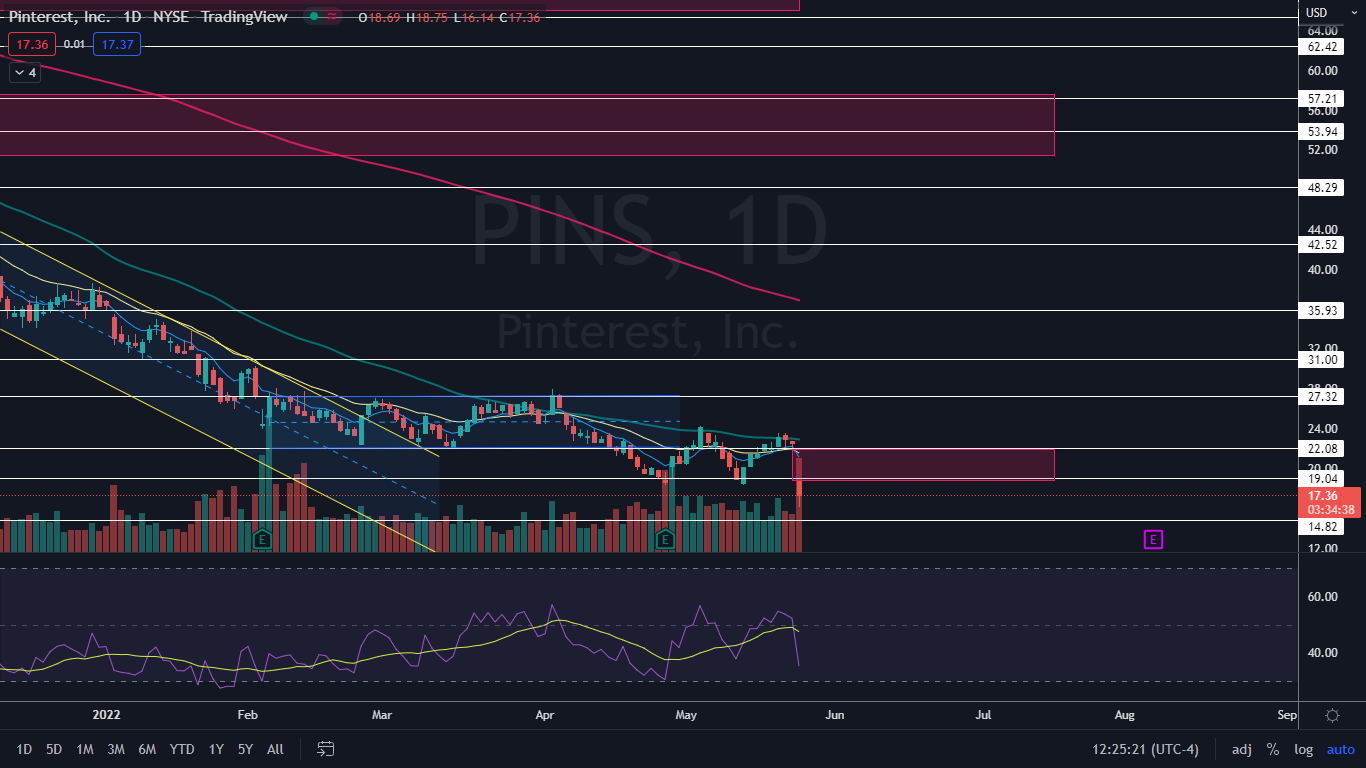
 The Pinterest Chart: Pinterest’s downtrend took the stock to a new 52-week low of $16.14 on Tuesday, further confirming its downtrend is still intact. Pinterest’s most recent lower high was printed on May 20 and $23.58 and the most recent confirmed lower low was created at $18.33 on May 12.
- At press time, Pinterest was working to print a hammer candlestick on the daily chart, which like a doji candlestick, indicates a bounce may be on the horizon. If Pinterest rises up on Wednesday, traders can watch for the stock to begin to fill its closest gap between $18.69 and $21.94.
- Pinterest has two additional upper gaps, which are likely to fill at some point in the future. The first lies between $51.39 and $57.63 and the second between the $66 and $70.20 range.
- The stock has resistance above at $19.04 and $22.08 and support below at $14.82 and $10.51.
© 2025 Benzinga.com. Benzinga does not provide investment advice. All rights reserved.
Trade confidently with insights and alerts from analyst ratings, free reports and breaking news that affects the stocks you care about.
 See Also: