
Zinger Key Points
- Alibaba shares are trading sharply higher after the company reported better-than-expected Q4 EPS and sales results.
- Alibaba has a 52-week high of $230.89 and a 52-week low of $73.28.
- Find out which stock just claimed the top spot in the new Benzinga Rankings. Updated daily— discover the market’s highest-rated stocks now.
Alibaba Group Holdings, Inc BABA gapped up over 5% off Wednesday’s close and was surging over 12% after printing fourth-quarter and full-year 2021 financial results.
For the quarter, Alibaba reported non-GAAP earnings per ADS of $1.15 on revenues of $32.19 billion, which beat the consensus estimate of $1.10 and revenues of $29.94 billion.
The Chinese multinational e-commerce company’s posted strong growth despite many months of regulatory crackdowns imposed by the Chinese government, as well as continued supply chain woes caused by the COVID-19 pandemic.
Alibaba has been heavily beaten down since reaching an Oct. 27, 2020 all-time high of $319.32, plunging 77% to reach a low of $73.28 on March 15 -- a level the stock hasn’t traded at since Feb. 29, 2016.
Although Alibaba has made some short-lived bull runs over the past two months, the stock has all but given its gains back each time, closing Wednesday’s session at $83.31. Although a long-term reversal to the upside seems unlikely at this point, considering the overall market conditions, Alibaba may be in for another bull run following its break from a falling channel pattern.
Want direct analysis? Find me in the BZ Pro lounge! Click here for a free trial.
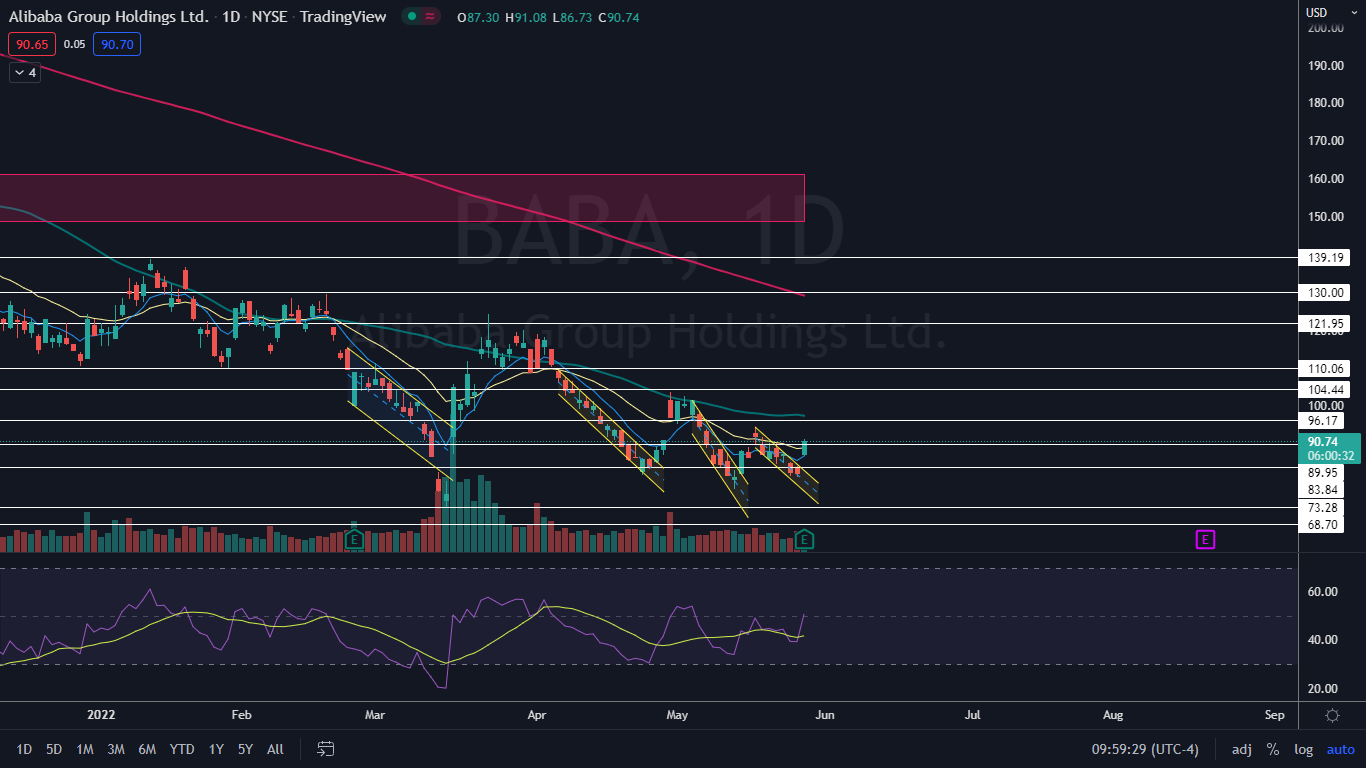
The Alibaba Chart: The positive reaction to Alibaba’s earnings print caused the stock to break bullishly from a falling channel pattern. The pattern is considered bearish until a stock breaks up from the upper descending trendline, which can signal a reversal into an uptrend is in the cards. Alibaba has a history of trading in falling channels before breaking up from the formations.
- The gap up open caused Alibaba to regain support at the eight-day and 21-day exponential moving averages (EMAs), which is a good sign for the bulls. If the stock is able to close the trading session above the 21-day EMA and remain trading above it for a few days, the eight-day EMA will eventually cross above the 21-day, which would give bullish traders more confidence going forward.
- Although Alibaba has made the first sign of negating its downtrend, by forming a higher high above the most recent lower high of 90.17 printed on May 20, the stock will eventually need to print a higher low above Wednesday’s low-of-day, to confirm an uptrend. Bullish traders and investors can watch for Alibaba to potentially form a reversal candlestick, such as a doji or hammer candlestick, above that level to enter a position.
- Alibaba has resistance above at $96.17 and $104.44 and support below at $89.95 and $83.84.
Edge Rankings
Price Trend
© 2025 Benzinga.com. Benzinga does not provide investment advice. All rights reserved.
Trade confidently with insights and alerts from analyst ratings, free reports and breaking news that affects the stocks you care about.

