Lululemon Athletica, Inc LULU is set to print its first-quarter financial results after the market closes on Thursday.
When the Vancouver-based apparel giant printed its fourth-quarter results on March 29, the stock gapped up over 7% to start the following trading day and soared up over 10% on the trading days that followed to reach an April 20 high of $410.70.
For the fourth quarter, Lululemon printed an EPS beat, reporting adjusted earnings per share of $3.37, beating the $3.28 consensus estimate. The company reported revenues of $2.13 billion, which was inline with estimates.
For the first quarter, analysts estimate Lululemon will report earnings of $1.43 per share on revenues of $1.53 billion.
Nearing the even, two analysts recently weighed in with adjusted price targets. B. Riley Securities maintained its Buy rating but lowered the price target from $487 to $440 and Morgan Stanley upgraded the stock from Equal-Weight to Overweight and lowered the price target from $339 to $303
The reaction Lululemon receives post-earnings is likely to be the deciding factor on whether the stock will trade in bullish or bearish territory for the time being but from a technical standpoint, Lululemon looks set to soar higher.
Of course, holding stocks or options over an earnings print is akin to gambling because stocks can react bullishly to an earnings miss and bearishly to an earnings beat. Options traders particularly, those who are holding close dated calls or puts, take on extra risk because the intuitions writing the options increase premiums to account for implied volatility.
The implied move for options of Lululemon expiring this week is 9.87%.
Want direct analysis? Find me in the BZ Pro lounge! Click here for a free trial.
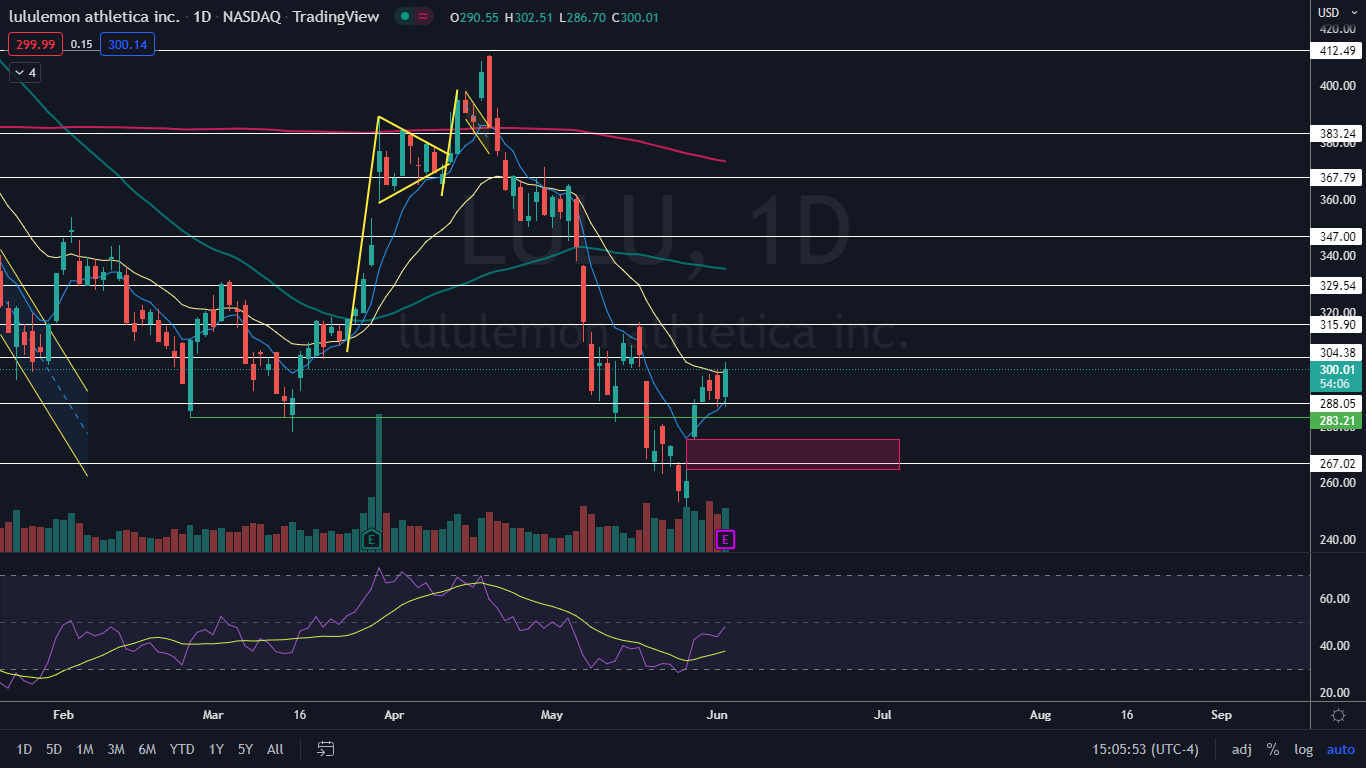
The Lululemon Chart: Lululemon confirmed it’s trading in an uptrend on Thursday, by printing a higher high above Wednesday’s high-of-day at the $299.70 mark. The first higher low in the pattern was formed on that same day at $286.87.
The stock may also be trading higher in reaction to a break up from a possible bull flag pattern on the daily chart, with the pole formed between May 25 and May 27 and the flag formed between Tuesday and Wednesday. The measured move of the pattern is 18%, which suggests Lululemon could trade up toward the $340 level.
On Thursday, Lululemon regained support at the 21-day exponential moving average (EMA). If the stock is able to trade above the level for a few days, the eight-day EMA will cross above the 21-day, which would give bullish traders more confidence going forward.
If Lululemon suffers a bearish reaction to its earnings print, the stock is likely to fall down into the lower gap, which was left behind on May 26. Gaps on charts fill about 90% of the time, which indicates the stock is likely to fill the empty range at some point in the future, regardless of whether that happens on Friday.
Lululemon has resistance above at $304.38 and $315.90 and support below at $288.05 and $267.02.

See Also: How Lululemon Athletica Could Trade After Earnings
© 2025 Benzinga.com. Benzinga does not provide investment advice. All rights reserved.
Trade confidently with insights and alerts from analyst ratings, free reports and breaking news that affects the stocks you care about.