
Sunrun, Inc RUN surged up 15% off Friday’s close at one point on Monday before retracing to trade about 9% higher.
A report that President Joe Biden intends to announce a two-year solar panel tariff exemption for Cambodia, Malaysia, Thailand and Vietnam later Monday set stocks in the sector flying, with many gapping up to start the trading day.
Continued volatility in the general markets hampered the move north, with the S&P 500 looking to break higher initially before falling down to trade mostly flat.
Sunrun’s retracement to almost completely fill the lower gap isn’t all bad news for bullish investors, asgaps on charts fill about 90% of the time and bullish traders prefer lower gaps are not left behind.
The retracement lower may also help to cool the stock’s relative strength index (RSI), which is headed on a steep slope toward overbought territory.
RSI is an indicator technical traders use to measure bullish and bearish price momentum. RSI levels can range between zero and 100, with levels between 30 and 70 generally considered to be healthy.
- When a stock’s RSI reaches above the 70% level, it's considered to be overbought. When a stock enters overbought territory, it indicates the securities price no longer reflects the asset's true value, which can signal a reversal to the downside is in the cards.
- When a stock’s RSI falls below the 30% area, it is considered to be oversold. When a stock enters oversold territory, it signals the securities price is below its intrinsic value, which can signal a reversal to the upside is on the horizon.
- RSI is best used when combined with other signals and patterns on a stock chart because stocks can remain in oversold and overbought territory for an extended period of time before reversing.
Want direct analysis? Find me in the BZ Pro lounge! Click here for a free trial.
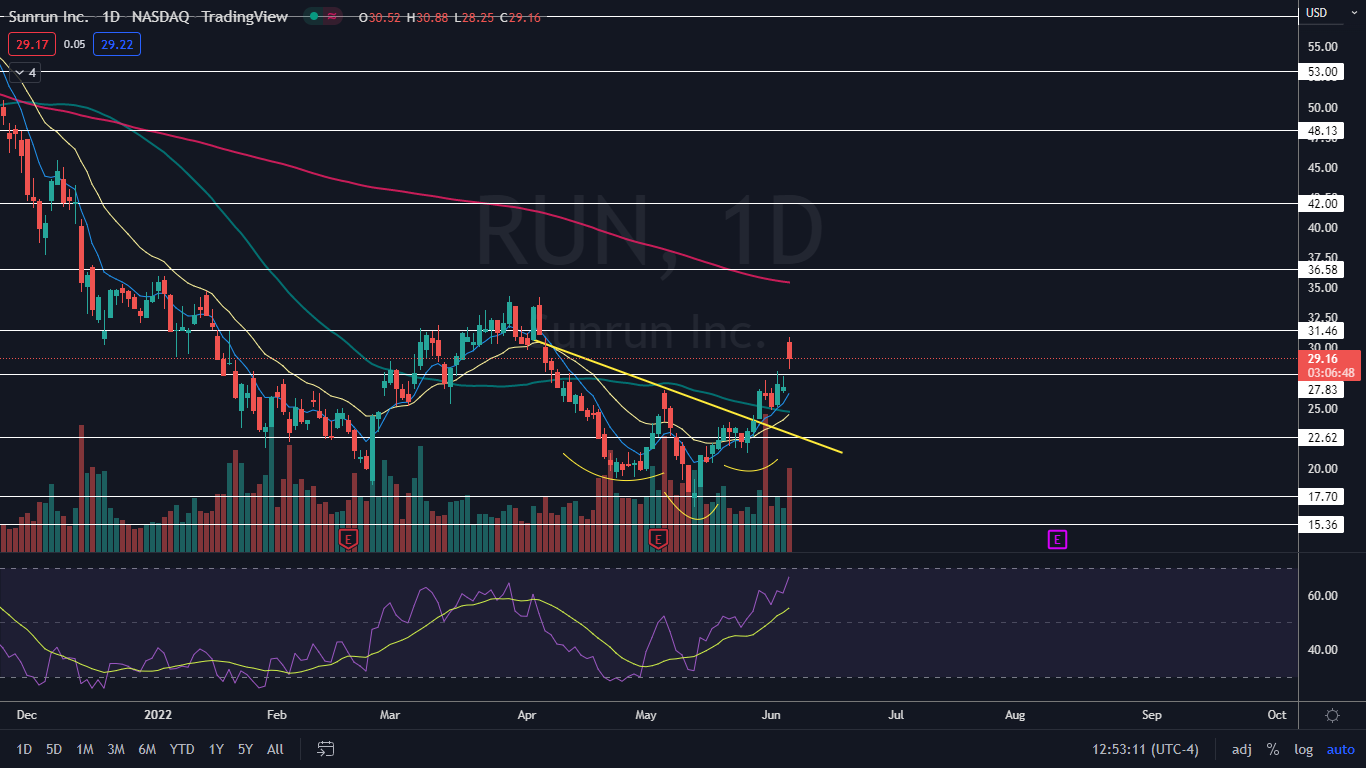
The Sunrun Chart: On Monday, Sunrun’s RSI was measuring in at about 67%. Bullish traders would prefer to see that number come down slightly to form another higher low, which could entice more buyers into the stock.
- On May 27, Sunrun broke up from a possible inverted head-and-shoulders pattern on the daily chart and the stock’s continued momentum within its uptrend could be a result of the formation being recognized by the algorithms. The measured move of the pattern is about 36%, which suggests Sunrun could rise up toward the $32 level, which the stock almost completed on Monday.
- The completed move doesn’t mean Sunrun can’t rise further because the stock is trading in a confirmed uptrend. The most recent higher low was printed on June 1 at $24.85 and the most recent confirmed higher high was formed at the $27.30 mark the day prior.
- If Monday’s high-of-day serves as the next higher high within the pattern, bullish traders can watch for a retracement to the downside for a possible higher low to print, which could provide a solid entry point.
- Bearish traders want to see Sunrun begin to trade sideways in consolidation and then for big bearish volume to come in and break the stock down to print a lower low and negate the downtrend.
- Sunrun has resistance above at $31.46 and $36.58 and support below at $27.83 and $22.62.
 See Also:
 © 2024 Benzinga.com. Benzinga does not provide investment advice. All rights reserved.
Comments
Trade confidently with insights and alerts from analyst ratings, free reports and breaking news that affects the stocks you care about.

