Zinger Key Points
- The stock negated its downtrend on May 31, when Coinbase printed a higher high of $88.32
- Bearish traders want to see Coinbase fall back under the trendline, towards its all-time low of $40.83.
- In a market dominated by tariff tensions, geopolitical surprises, and Fed uncertainty, Matt Maley's technical approach delivers clear entry & exit points for consistent income potential. Try it free for 7 days
Coinbase Global, Inc COIN surged 12% over Friday’s closing price on Monday morning, before retracing down to trade about 5% higher at press time.
Bitcoin BTC/USD spiking up almost 5% higher helped Coinbase to hang onto some of its gains, while the general market fell from its high-of-day after trapping bulls in what appeared to be a potential break out for the S&P 500.
The cryptocurrency market has been in a long-term slumber after the apex cryptos, Bitcoin and Ethereum ETH/USD fell significantly from their Nov. 10, 2021 highs of $69,000 and $4,867.81, respectively. Now trading down 54% and 62% from those all-time highs, Coinbase has also struggled to gain traction after plunging about 80% from its 52-week high of $368.90, printed on Nov. 9, 2021.
That may be set to change if Coinbase can get follow-through on the break of a descending trendline, which the stock broke up through on Monday.
A descending trendline acts as a resistance level and indicates there are more sellers than buyers, as the price continues to fall.
In order for a trendline to be considered valid, the stock or crypto must touch the line on at least three occasions. After that, the more times the trendline is touched, the weaker it becomes.
- Bullish traders can watch for a stock or crypto to break up from the descending trendline and, if the break happens on high volume, can indicate the downtrend is over and a rally may be on the horizon. It's possible the stock or crypto may fall down to back-test the descending trendline as support before heading higher again.
- For bearish traders “the trend is your friend” (until it’s not) and a touch and rejection of the descending trendline can offer a good short entry. A bearish trader would stop out of this type of trade if the stock or crypto broke above the trendline.
Want direct analysis? Find me in the BZ Pro lounge! Click here for a free trial.
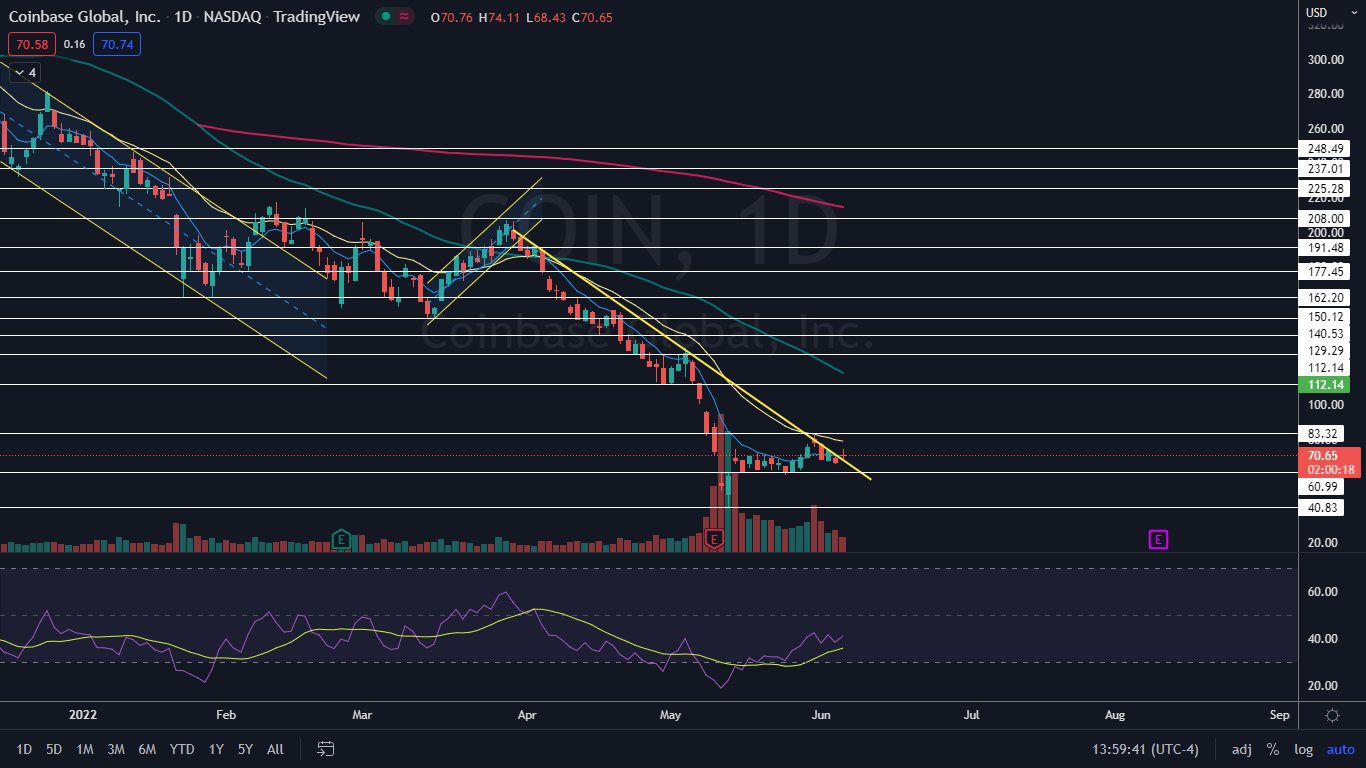
The Coinbase Chart: The descending trendline on Coinbase’s chart has been developing since March 30, when the stock entered into a fairly consistent and long-term downtrend. On Monday, Coinbase opened above the trendline and retraced to test the area as support.
- Although the stock negated its downtrend on May 31, when Coinbase printed a higher high of $88.32, which was above the previous lower high of 74.25 formed on May 13, the stock has yet to confirm a higher low has been created. Bullish traders will want to see the descending trendline hold as support and then for the stock to rise up to print a higher high, which would signal Friday’s low-of-day was a higher low.
- Bearish traders want to see Coinbase fall back under the trendline, which could continue pushing the stock lower, back toward the all-time low of $40.83. If Coinbase were to form a new all-time low, there is no support in the form of price history below.
- Coinbase has resistance above at $83.32 and $112.14 and support below at $60.99 and the psychologically important $50 mark.

See Also: Why Cathie Wood's ARKK Fund Is Up 17% Since May Bottom
Photo: Courtesy of Marco Verch Professional Photographer on Flickr
Edge Rankings
Price Trend
© 2025 Benzinga.com. Benzinga does not provide investment advice. All rights reserved.
Trade confidently with insights and alerts from analyst ratings, free reports and breaking news that affects the stocks you care about.