Zinger Key Points
- NUGT is a double leveraged fund that is designed to outperform the NYSE Arca Gold Miners Index
- Leveraged ETF’s should never be used by an investor with a buy and hold strategy or those who have low risk appetites
- Feel unsure about the market’s next move? Copy trade alerts from Matt Maley—a Wall Street veteran who consistently finds profits in volatile markets. Claim your 7-day free trial now.
Direxion Daily Gold Miners Index Bull 2X Shares NUGT was trading down about 2% on Monday in continued consolidation after plunging over 6% lower on Thursday.
The gold miners sector recently enjoyed a long bull-cycle, which lasted from Jan. 28 to April 18 of this year and caused NUGT to soar 102% higher during that timeframe. Since late April, NUGT has erased all of its gains, however, plunging 54% from its 52-week high of $82.86.
NUGT is a double leveraged fund that is designed to outperform the NYSE Arca Gold Miners Index. The ETF tracks a number of gold and silver mining companies through its four holdings, with the VanEck Gold Miners ETF GDX and the U.S. Dollar making up 91.27% of its weighted holdings.
The other two funds making up the remainder of NUGT’s weightings are Goldman Sachs Trust Financial Square Treasury Instruments Fund Institutional, weighted at 8.49% and Dreyfus Government Cash Management Funds Institutional, with a 0.23% weighting.
It should be noted that leveraged ETFs are meant to be used as a trading vehicle as opposed to a long-term investment by experienced traders. Leveraged ETF’s should never be used by an investor with a buy and hold strategy or those who have low risk appetites.
Want direct analysis? Find me in the BZ Pro lounge! Click here for a free trial.
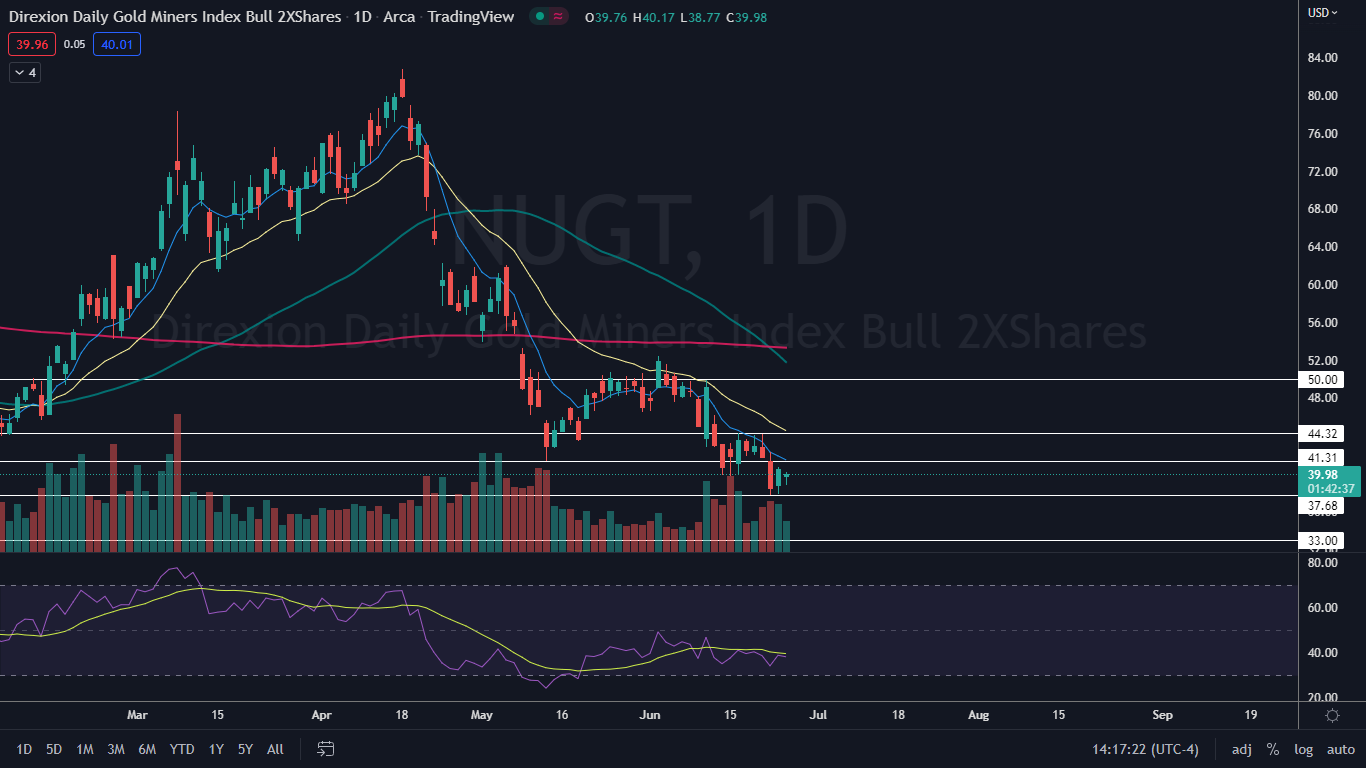
The NUGT Chart: On Friday and Monday, NUGT was trading sideways within Thursday’s trading range, which has settled the ETF into a double inside bar pattern on the daily chart. The pattern leans bearish in this case because NUGT was trading low before forming the pattern, but traders can watch for a break up or down from Thursday’s mother bar on higher-than-average volume to gauge future direction.
- NUGT is also trading in a confirmed downtrend, with the most recent lower high printed on June 16 at $44.24 and the most recent lower low formed at the $37.68 mark on Thursday. If NUGT breaks bearishly from the inside bar pattern, the downtrend will continue, but if the ETF breaks bullishly from the formation, the downtrend will be negated and a reversal to the upside could be in the cards.
- A bounce to the upside is likely to come over the next few trading days because NUGT has developed bullish divergence on the daily chart. Bullish divergence occurs when a stock makes a series of lower lows but its relative strength index (RSI) makes a series of higher lows. For the divergence to correct, NUGT will either need to trade higher or plummet low enough to drop the RSI below 30%.
- For traders looking to play a leveraged gold miners ETF bear, Direxion Daily Gold Miners Index Bull 2X Shares DUST is an option.
- NUGT has resistance above at $41.31 and $44.32 and support below at $37.68 and $33.

Edge Rankings
Price Trend
© 2025 Benzinga.com. Benzinga does not provide investment advice. All rights reserved.
Trade confidently with insights and alerts from analyst ratings, free reports and breaking news that affects the stocks you care about.