Zinger Key Points
- SOXS is a triple leveraged fund that offers inverse correlation to the semiconductor sector.
- The inverse ETF is consolidating after breaking up bullishly from a bull flag pattern.
- Brand New Membership Level: Benzinga Trade Alerts
Direxion Daily Semiconductor Bear 3X Shares SOXS gained ground in Thursday's session after gapping up to start Wednesday’s trading day and rallying 3% off the open.
The semiconductor sector recently suffered a downturn that lasted from June 6 to June 17, which caused SOXS to soar 82% higher during that time frame. On June 21, the sector began to rebound slightly, with caused SOXS to slide about 25% in consolidation.
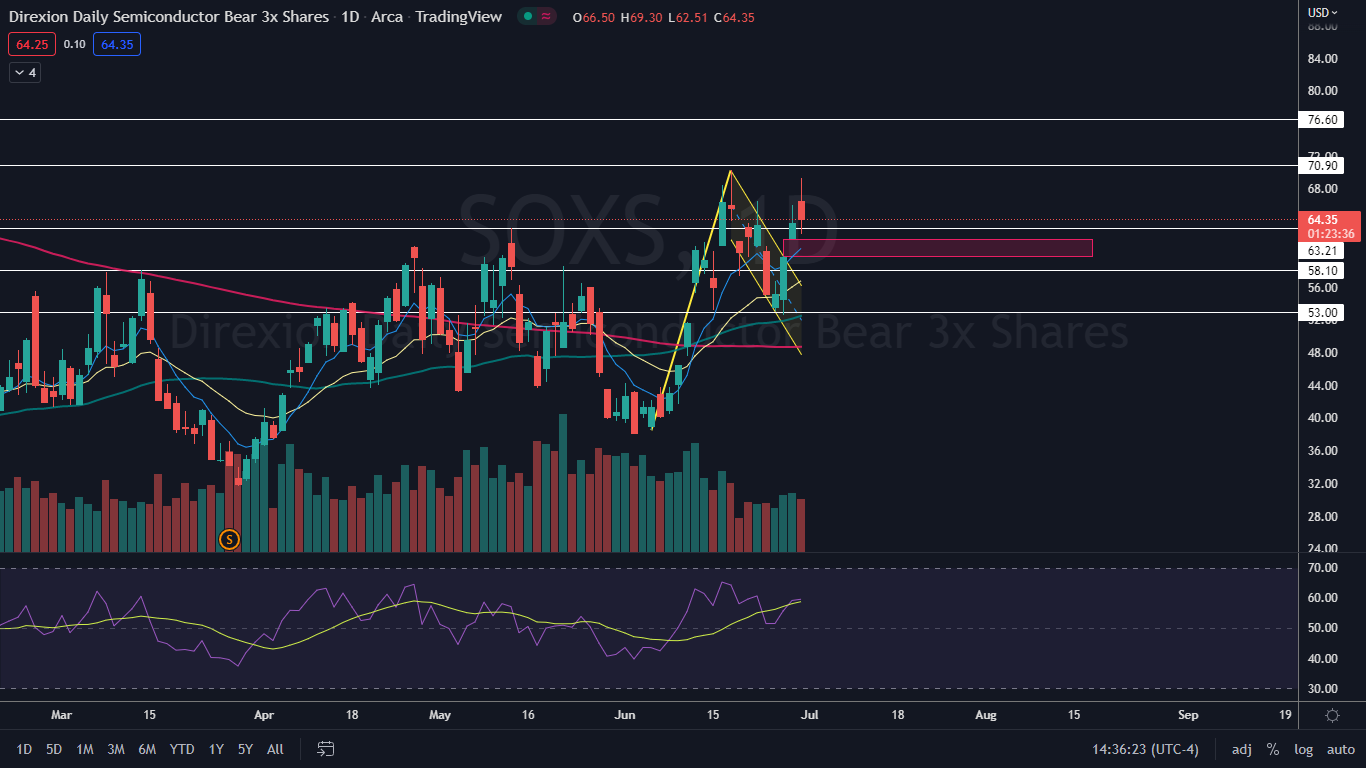
SOXS’s sharp rise, paired with the downward consolidation, settled the inverse ETF into a bull flag pattern on the daily chart.
SOXS is a triple leveraged fund that offers 3x daily short leverage to the PHLX Semiconductor Index. The ETF tracks inversely to a number of semiconductor companies through its four holdings, with Goldman Sachs Trust Financial Square Treasury Instruments Fund Institutional and a mutual fund making up 58% of its weighted holdings.
The other two funds making up the remainder of SOXL’s weightings are Dreyfus Government Cash Management Funds Institutional, weighted at 23.28%, and U.S. Dollar, with a 18.33% weighting.
It should be noted that leveraged ETFs are meant to be used as a trading vehicle as opposed to a long-term investment by experienced traders. Leveraged ETFs should never be used by an investor with a buy and hold strategy or those who have low risk appetites.
Want direct analysis? Find me in the BZ Pro lounge! Click here for a free trial.
The SOXS Chart: SOXS’s bull flag pattern was developed between June 6 and June 17 and the flag was formed between June 21 and Tuesday. On Wednesday, SOXS reacted to the pattern and gapped up above the upper descending trendline of the flag. The inverse ETF didn’t receive bullish momentum to the upside on Thursday, however, and instead began to consolidate while the S&P 500 enjoyed a fairly bullish day.
- When SOXS broke up from the bull flag pattern, the inverse ETF negated the downtrend it was trading in within the flag formation. SOXS has not yet confirmed a new uptrend will begin because the inverse ETF hasn’t yet printed a lower high above the most recent high of $69.30. If SOXS falls further over the coming days, traders can watch for the inverse ETF to form a bullish reversal candlestick, such as a doji or hammer candlestick, above the most recent low of $52.57, which could indicate the uptrend will begin.
- There is a gap below on SOXS’s chart between $59.66 and $61.83, which was left behind on Wednesday. Gaps on charts fill about 90% of the time, which makes it likely the inverse ETF will fall down to fill the empty trading range in the future. Traders can watch for the gap to possibly fill if and when SOXS forms its next higher low.
- There is resistance above at $70.90 and $76.60 and support below at $63.21 and $58.10.
Traders who are bullish on the semiconductor sector can track the Direxion Daily Semiconductor Bear 3X Shares SOXL. See Also: CNBC's Final Trades: Buy Coca-Cola And Health Care, Short These Two
© 2025 Benzinga.com. Benzinga does not provide investment advice. All rights reserved.
Trade confidently with insights and alerts from analyst ratings, free reports and breaking news that affects the stocks you care about.