Zinger Key Points
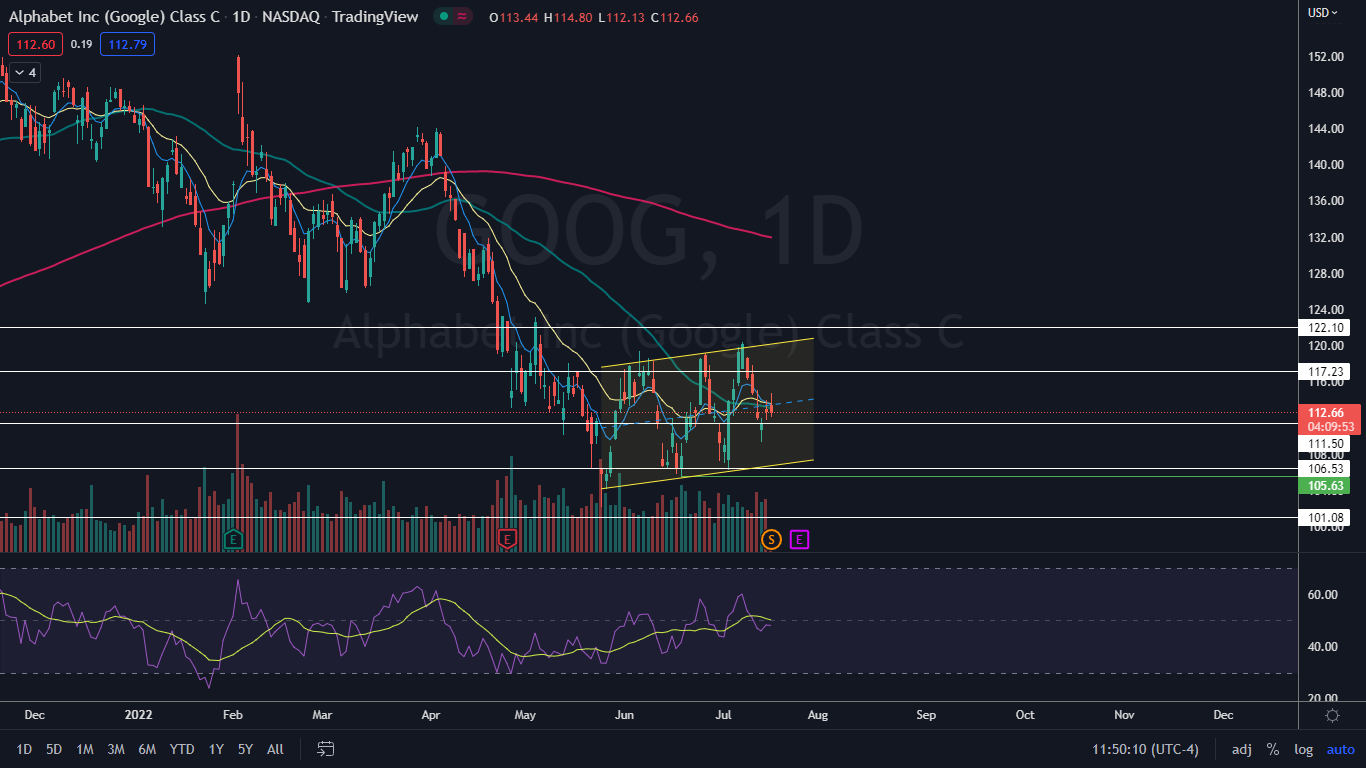
- Alphabet is trading in an uptrend between two parallel trendline of a rising channel pattern.
- Bullish traders want to see the stock hold above Friday's low-of-day.
- China’s new tariffs just reignited the same market patterns that led to triple- and quadruple-digit wins for Matt Maley. Get the next trade alert free.
Alphabet Inc GOOG GOOGL was trading mostly flat on Monday following a 20-1 stock split. The split brought shares of Alphabet’s Class C stock (GOOG) down from Friday’s closing price of $2,255.34 to a split-adjusted price of $113.44.
The stock split means that every shareholder received 19 additional shares for each share of Alphabet they owned. The split made shares of the tech giant more attractive to retail investors and for options traders, and the price of both calls and puts has also become more affordable.
Alphabet didn’t run up higher into the event, although the stock reversed course into an uptrend on June 17, which may have surprised investors who watched Tesla Inc TSLA and Apple Inc AAPL surge prior to their stock splits in 2020.
The patterns Alphabet developed on its chart prior to the split taking place are still intact, although technical traders will need to adjust their levels of support and resistance now that Alphabet’s stock price has essentially been divided by 20.
Want direct analysis? Find me in the BZ Pro lounge! Click here for a free trial.
The Alphabet (GOOG) Chart: Alphabet’s most recent higher low in its uptrend was printed on July 14 at $109.33 and the most recent higher high was formed at the $120.44 mark on July 8. On Monday, Alphabet temporarily shot up above Friday’s high-of-day but sellers came in and dropped the stock back down into Friday’s trading range.
Bullish traders will want to see Alphabet close the trading day either within Friday’s trading range or for bulls to come in and cause the stock to close up near its high-of-day price. If the stock loses Friday’s low, Monday’s high-of-day may serve as a lower high, which could settle Alphabet into either a tightening range or a downtrend.
If the stock forms a downtrend by trading under the most recent higher low, Alphabet may find support at the lower ascending trendline of a rising channel, which it has been trading in since May 25. A rising channel is considered to be bullish for the short-term but if a stock drops through the bottom trendline a larger downtrend can occur.
Alphabet is trading slightly below the eight-day and 21-day exponential moving average (EMA), with the eight-day EMA trending in line with the 21-day. Bullish traders will want to see Alphabet regain both moving averages as support in short order to avoid seeing the eight-day EMA cross below the 21-day, which would be bearish.
Alphabet has resistance above $117.23 and $122.10 and support below at $111.50 and $106.53.
 See Also: What The Imminent Alphabet Stock Split Means For Investors
Photo: II.studio via Shutterstock
Edge Rankings
Price Trend
© 2025 Benzinga.com. Benzinga does not provide investment advice. All rights reserved.
Trade confidently with insights and alerts from analyst ratings, free reports and breaking news that affects the stocks you care about.