AMC Entertainment Holdings, Inc AMC has continued to trend higher over the past week, which Benzinga pointed out was likely to occur on July 13. Instead of breaking up from an inside bar pattern, the stock printed a bull flag and broke up from the upper descending trendline of the flag formation on Monday.
The bull flag pattern is created with a sharp rise higher forming the pole, which is then followed by a consolidation pattern that brings the stock lower between a channel with parallel lines or into a tightening triangle pattern.
- For bearish traders, the "trend is your friend" (until it's not) and the stock may continue downward within the following channel for a short period of time. Aggressive traders may decide to short the stock at the upper trendline and exit the trade at the lower trendline.
- Bullish traders will want to watch for a break up from the upper descending trendline of the flag formation, on high volume, for an entry. When a stock breaks up from a bull flag pattern, the measured move higher is equal to the length of the pole and should be added to the lowest price within the flag.
A bull flag is negated when a stock closes a trading day below the lower trendline of the flag pattern or if the flag falls more than 50% down the length of the pole.
In The News: AMC has been trending on social media due to its potential for short squeeze and because of a number of newly released films that have performed well at the box office. AMC had 19.66% of its 515.5-million share float held short as of June 30, according to Benzinga Pro.
"Top Gun: Maverick," "Minions: The Rise of Gru" and "Thor: Love and Thunder" have all ranked high at the box office recently, with the new Minions sequel generating $26 million last weekend alone.
Want direct analysis? Find me in the BZ Pro lounge! Click here for a free trial.
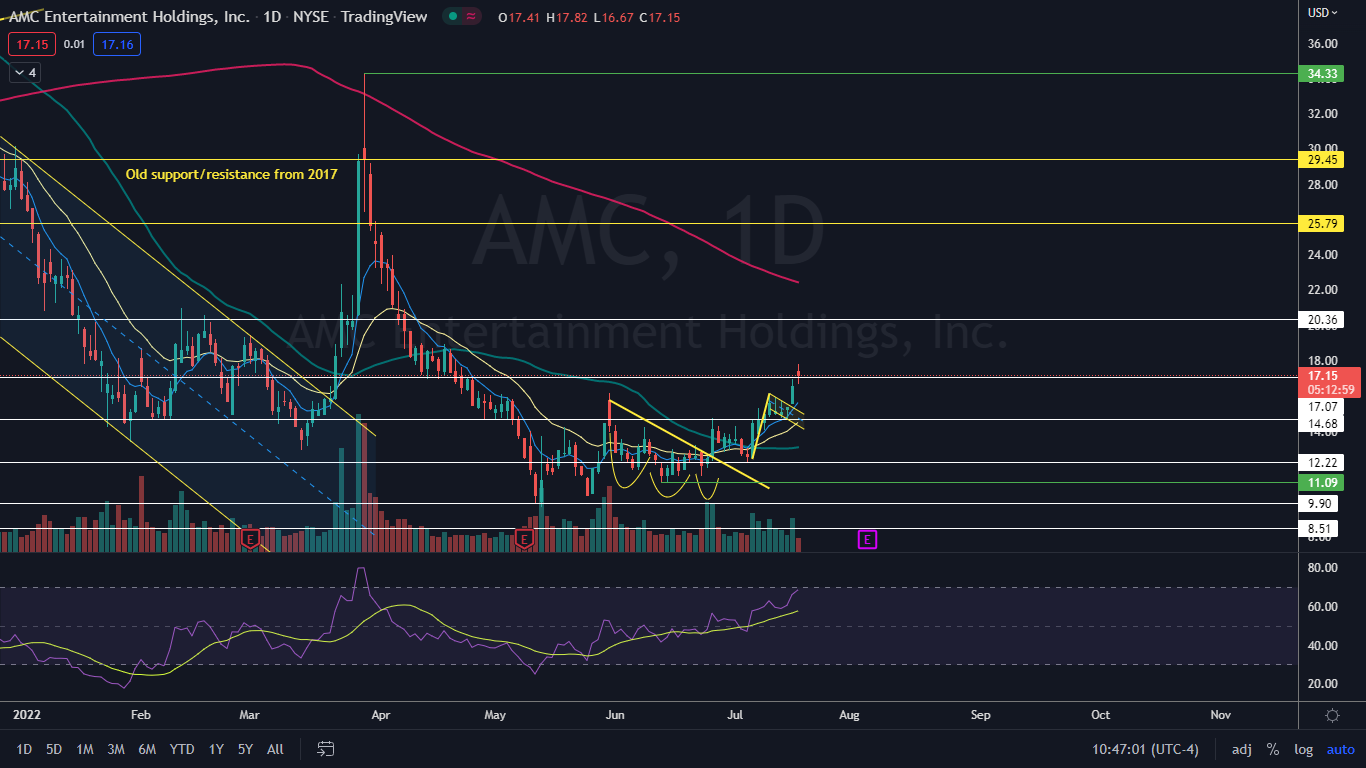
The AMC Chart: AMC gapped up over 5% to start the trading day on Tuesday but ran into a group of sellers, who knocked the stock down to trade about 2.5% higher at press time. AMC is in need of a period of consolidation after rallying 6.5% on Monday for a total of 33% since July 7.
- The trek higher on Monday was due to the recognition of a bull flag pattern that AMC had developed between July 7 and Friday, with the pole formed during the first four days of that time frame and the flag created over three trading days that followed. The measured move of the pattern is 28%, which suggests AMC could rise toward the $19 level over the coming days.
- AMC is also trading in a confirmed uptrend, with the most recent higher high printed on July 12 at $16.14 and the most recent higher low formed at the $14.71 mark on Friday.
- If Tuesday’s high-of-day serves as the next higher high within the pattern, bullish traders who aren’t already in a position can watch for AMC to print another reversal candlestick to signal another higher low is in above the $15 level.
- AMC is trading above the eight-day and 21-day exponential moving averages (EMAs), with the eight-day EMA trending above the 21-day, both of which are bullish indicators. The stock is also trading above the 50-day simple moving average, which indicates longer-term sentiment is bullish.
- AMC has resistance above at $20.36 and $25.79 and support below at $17.07 and $14.68.
 See Also: How to Read Candlestick Charts for Beginners
Photo courtesy of AMC.
© 2024 Benzinga.com. Benzinga does not provide investment advice. All rights reserved.
Comments
Trade confidently with insights and alerts from analyst ratings, free reports and breaking news that affects the stocks you care about.

