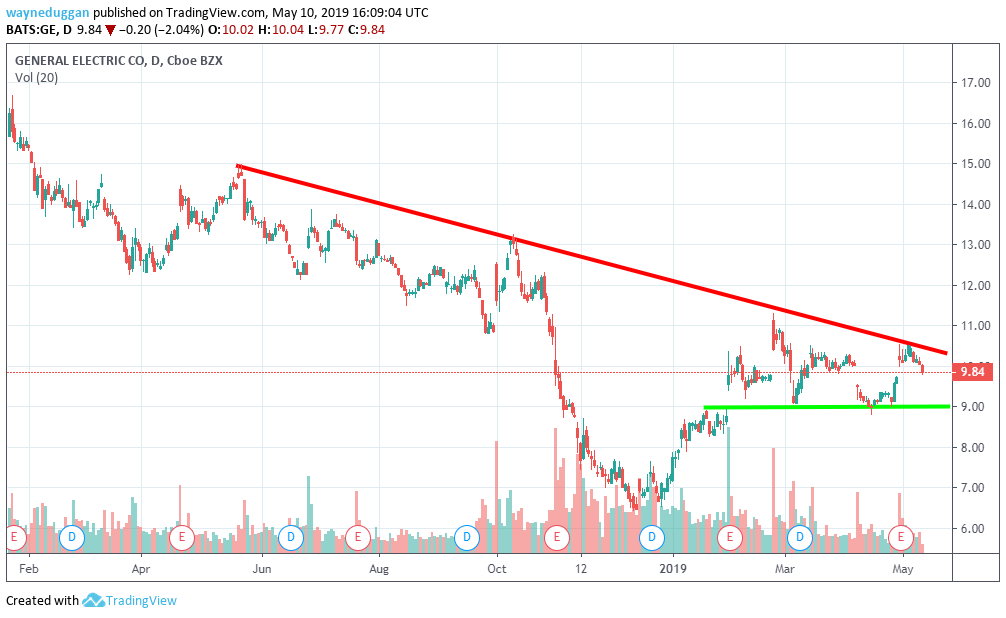
For years, General Electric Company GE investors have been waiting on a reason to get bullish about the stock’s technical outlook. Unfortunately, the trade war sell-off this week has thwarted the stock’s latest attempt at a technical breakout to the upside, and GE shares appear to still be stuck in their long-term bearish trading pattern for the time being.
Tight Trading Range
The red resistance line in the chart below represents the key long-term bearish resistance level that GE can’t seem to get past. After a double-bottom at $6.50 back in December 2018, GE rallied hard in the opening months of 2019, reaching as high as $11.28 in February.

Since that time, the stock has twice pulled back to support at the $9 level, but the failed breakout in February coupled with a second failed breakout earlier this month suggests that pesky bearish resistance line is still dictating the trading action for now.
In the near term, GE is forming a bearish descending triangle pattern, in which the share price is getting pinched between horizontal support at $9 and descending resistance, currently at around $10.25. Unfortunately for GE bulls, the descending triangle typically suggests a bearish breakdown is coming at some point, especially when it occurs within a longer-term downtrend. The triangle pattern is often formed during a consolidation period after a stock has declined steeply in a short period of time.
GE shares fell 44 percent in the second half of 2018.
Looking to gain an edge in your trading and investing? Look no further than the Benzinga Trading & Investing Summit this June 20 in NYC!
Key Levels
In the near term, GE traders can expect the stock to at least re-test the $9 support level in coming days. If it bounces from there, expect near-term upside is limited to around $10.25.
A breakout above $10.25 on heavy volume would be a very noteworthy and bullish development. A continuation to February highs of $11.28 could at least be confirmation that the December lows of $6.50 are the ultimate bottom for GE.
If the descending triangle pattern does, in fact, result in a breakdown below $9, the $6.50 level is the last potential support level keeping GE from making fresh lows in the longer-term.
GE's stock traded at $10 per share at time of publication.
Related Links:
Trade War Sell-Off Does Major Technical Damage To FXI Fund's Chart
Colas: Why Trump's Tariff Timing Is No Coincidence — And Investors Shouldn't Worry
Photo credit: Momoneymoproblemz, via Wikimedia Commons
Edge Rankings
Price Trend
© 2025 Benzinga.com. Benzinga does not provide investment advice. All rights reserved.
Trade confidently with insights and alerts from analyst ratings, free reports and breaking news that affects the stocks you care about.