Zinger Key Points
- Apple broke down from a rising channel pattern and entered a downtrend.
- The stock has been consolidating recently, holding above a key support at $177.71.
- Feel unsure about the market’s next move? Copy trade alerts from Matt Maley—a Wall Street veteran who consistently finds profits in volatile markets. Claim your 7-day free trial now.
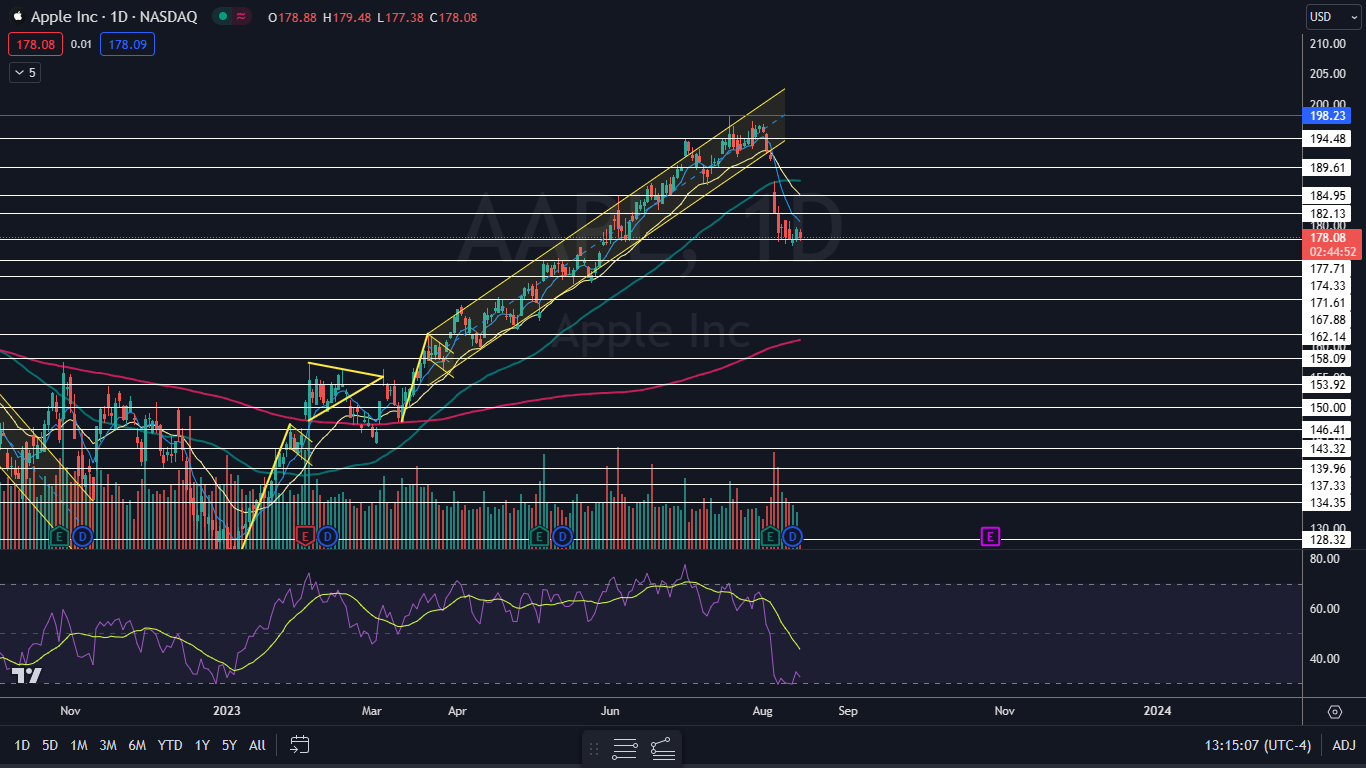
Apple, Inc AAPL was dropping about 0.7% on Tuesday, continuing to fall slightly lower within a downtrend pattern after breaking bearishly from a rising channel pattern on Aug. 3.
The Cupertino, California-based company was reacting negatively to stronger-than-expected retail sales data for July, which was released by the U.S. Census Bureau, pulling the market lower due to how heavily weighted Apple is in the S&P 500.
A downtrend occurs when a stock consistently makes a series of lower lows and lower highs on the chart.
The lower lows indicate the bears are in control while the intermittent lower highs indicate consolidation periods.
Traders can use moving averages to help identify a downtrend with descending lower timeframe moving averages (such as the eight-day or 21-day exponential moving averages) indicating the stock is in a steep shorter-term downtrend.
Descending longer-term moving averages (such as the 200-day simple moving average) indicate a long-term downtrend.
If Apple’s downtrend continues, volatility in the stock market is likely to continue rising. Traders looking for continuation in elevated volatility in the stock market can use MIAX’s SPIKES Volatility products. The products, which are traded on SPIKES Volatility Index SPIKE, track expected volatility in the SPDR S&P 500 over the next 30 days.
Read Next: This Fund Gained Almost 85% So Far This Year - The Best Volatility ETFs Of 2023
The Apple Chart: Apple fell under the lower ascending trend line of a rising channel pattern on Aug. 3 on increasing volume, which signaled further downside was likely on the horizon. The following day, big bearish volume entered the stock, causing Apple to gap down 2.7% and fall an additional 1.83% intraday.
- On Aug. 7, Apple dropped another 1.8% to the $177.71 mark, which has been holding as support since that date, although the stock has continued to make a series of lower highs and lower lows. The most recent lower high was formed on Aug. 9 at $180.93 and the most recent confirmed lower low was printed at the $176.55 mark on Friday.
- Apple’s daily trading volume has been decreasing, which indicates the stock is in a period of consolidation. If Apple continues within the downtrend and forms another lower low, bearish volume is likely to increase, dropping the stock further.
- Bullish traders want to see accumulation begin to take place, with the relative strength index starting to rise. If that happens, the downtrend may come to an end.
- Apple has resistance above at $182.13 and at $184.95 and support below at $177.71 and at $174.33.
Image sourced from Shutterstock
Edge Rankings
Price Trend
© 2025 Benzinga.com. Benzinga does not provide investment advice. All rights reserved.
Trade confidently with insights and alerts from analyst ratings, free reports and breaking news that affects the stocks you care about.
 Read Next: